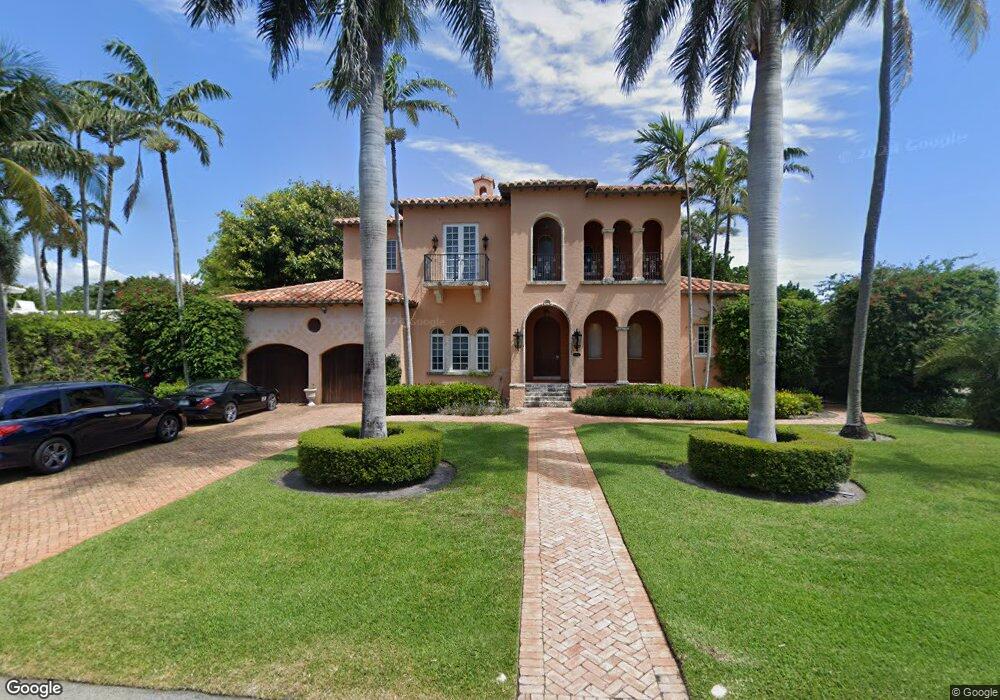
1041 Bauhinia Rd Delray Beach, FL 33483
Estimated Value: $5,656,738 - $7,426,000
--
Bed
4
Baths
4,408
Sq Ft
$1,538/Sq Ft
Est. Value
About This Home
This home is located at 1041 Bauhinia Rd, Delray Beach, FL 33483 and is currently estimated at $6,779,685, approximately $1,538 per square foot. 1041 Bauhinia Rd is a home located in Palm Beach County with nearby schools including Pine Grove Elementary School, Carver Middle School, and Atlantic High School.
Ownership History
Date
Name
Owned For
Owner Type
Purchase Details
Closed on
Mar 4, 2005
Sold by
Carballosa Joseph and Carballosa Jussara
Bought by
Pirog Ernest K
Current Estimated Value
Home Financials for this Owner
Home Financials are based on the most recent Mortgage that was taken out on this home.
Original Mortgage
$2,000,000
Interest Rate
5.6%
Mortgage Type
Purchase Money Mortgage
Purchase Details
Closed on
May 26, 1999
Sold by
Miles David and Miles Darline W
Bought by
Carballosa Joseph
Purchase Details
Closed on
Aug 31, 1993
Sold by
Spencer Doris H
Bought by
Miles David
Home Financials for this Owner
Home Financials are based on the most recent Mortgage that was taken out on this home.
Original Mortgage
$70,000
Interest Rate
7.24%
Create a Home Valuation Report for This Property
The Home Valuation Report is an in-depth analysis detailing your home's value as well as a comparison with similar homes in the area
Home Values in the Area
Average Home Value in this Area
Purchase History
| Date | Buyer | Sale Price | Title Company |
|---|---|---|---|
| Pirog Ernest K | $2,680,000 | Atlantic East Title Inc | |
| Carballosa Joseph | $400,000 | -- | |
| Miles David | $205,000 | -- |
Source: Public Records
Mortgage History
| Date | Status | Borrower | Loan Amount |
|---|---|---|---|
| Closed | Pirog Ernest K | $2,000,000 | |
| Previous Owner | Carballosa Joseph | $850,000 | |
| Previous Owner | Miles David | $70,000 |
Source: Public Records
Tax History Compared to Growth
Tax History
| Year | Tax Paid | Tax Assessment Tax Assessment Total Assessment is a certain percentage of the fair market value that is determined by local assessors to be the total taxable value of land and additions on the property. | Land | Improvement |
|---|---|---|---|---|
| 2024 | $76,141 | $3,571,741 | -- | -- |
| 2023 | $70,714 | $3,247,037 | $0 | $0 |
| 2022 | $63,426 | $2,951,852 | $0 | $0 |
| 2021 | $54,365 | $2,683,502 | $1,411,924 | $1,271,578 |
| 2020 | $59,393 | $2,907,284 | $1,442,000 | $1,465,284 |
| 2019 | $56,841 | $2,751,167 | $1,400,000 | $1,351,167 |
| 2018 | $54,208 | $2,680,499 | $1,421,058 | $1,259,441 |
| 2017 | $53,436 | $2,589,674 | $1,421,058 | $1,168,616 |
| 2016 | $55,596 | $2,569,987 | $0 | $0 |
| 2015 | $51,339 | $2,336,352 | $0 | $0 |
| 2014 | $48,358 | $2,146,716 | $0 | $0 |
Source: Public Records
Map
Nearby Homes
- 734 S Ocean Blvd
- 1017 Tamarind Rd
- 616 Seasage Dr
- 701 S Ocean Blvd
- 602 S Ocean Blvd
- 917 Bucida Rd Unit A
- 414 Seasage Dr Unit 30
- 1006 Casuarina Rd Unit 11
- 400 S Ocean Blvd Unit 215
- 555 SE 6th Ave Unit 2E
- 555 SE 6th Ave Unit 7H
- 555 SE 6th Ave Unit 11D
- 555 SE 6th Ave Unit 11E
- 555 SE 6th Ave Unit 3H
- 555 SE 6th Ave Unit 11G
- 400 Seasage Dr Unit 804
- 400 Seasage Dr Unit 402
- 400 Seasage Dr Unit 506
- 400 Seasage Dr Unit 904
- 369 Venetian Dr
- 1031 Bauhinia Rd
- 733 Seagate Dr
- 1020 Tamarind Rd
- 725 Seagate Dr
- 1010 Tamarind Rd
- 1140 Bauhinia Rd
- 721 Seasage Dr
- 707 Seasage Dr
- 1024 Bauhinia Rd
- 1202 Bauhinia Rd
- 0000 Tamarind Rd
- 717 Seagate Dr
- 726 S Ocean Blvd
- 711 Seagate Dr
- 1212 Bauhinia Rd
- 800 Seagate Dr
- 809 Seagate Dr
- 1017 Azalea Rd
- 700 Seasage Dr
- 1110 Bauhinia Rd