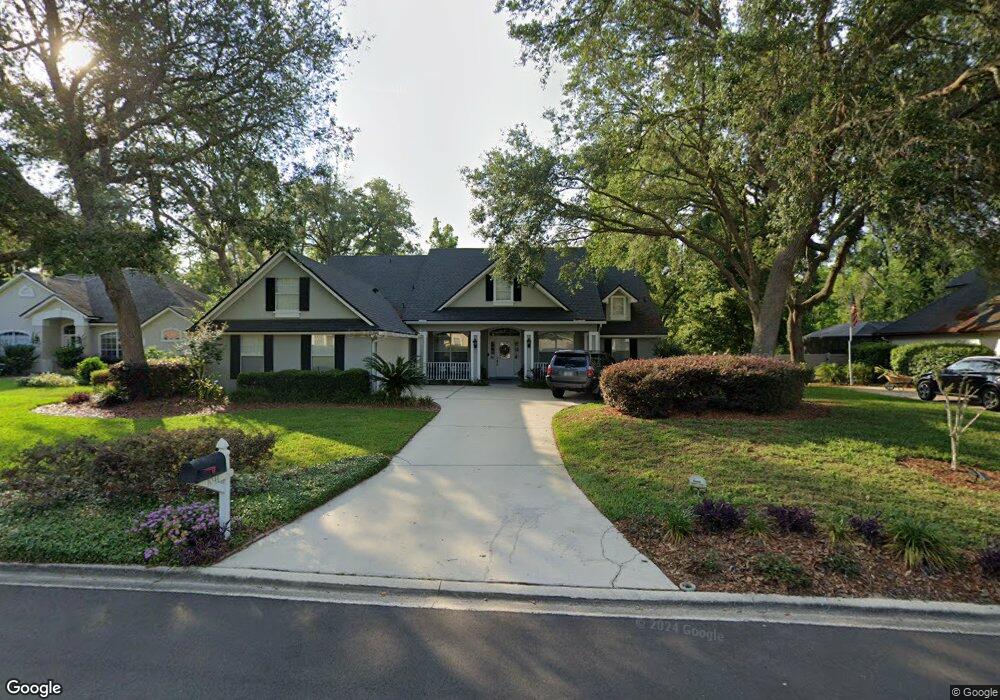
1041 Buckbean Branch Ln W Saint Johns, FL 32259
Estimated Value: $571,000 - $694,000
5
Beds
4
Baths
2,722
Sq Ft
$231/Sq Ft
Est. Value
About This Home
This home is located at 1041 Buckbean Branch Ln W, Saint Johns, FL 32259 and is currently estimated at $629,237, approximately $231 per square foot. 1041 Buckbean Branch Ln W is a home located in St. Johns County with nearby schools including Fruit Cove Middle School, Creekside High School, and San Juan del Rio Catholic School.
Ownership History
Date
Name
Owned For
Owner Type
Purchase Details
Closed on
Aug 27, 2010
Sold by
Davis Robert D and Davis Patricia
Bought by
Gay Linda D and Gay Scott T
Current Estimated Value
Home Financials for this Owner
Home Financials are based on the most recent Mortgage that was taken out on this home.
Original Mortgage
$296,013
Outstanding Balance
$196,061
Interest Rate
4.5%
Mortgage Type
FHA
Estimated Equity
$433,176
Purchase Details
Closed on
Feb 20, 2003
Sold by
Cendant Mobility Financial Corp
Bought by
Davis Robert D and Davis Patricia
Home Financials for this Owner
Home Financials are based on the most recent Mortgage that was taken out on this home.
Original Mortgage
$226,400
Interest Rate
5.89%
Purchase Details
Closed on
Nov 26, 2002
Sold by
Williams Rita K and Williams Thomas A
Bought by
Cendant Mobility Financial Corp
Create a Home Valuation Report for This Property
The Home Valuation Report is an in-depth analysis detailing your home's value as well as a comparison with similar homes in the area
Home Values in the Area
Average Home Value in this Area
Purchase History
| Date | Buyer | Sale Price | Title Company |
|---|---|---|---|
| Gay Linda D | $300,000 | Security Title Agency Inc | |
| Davis Robert D | $283,000 | -- | |
| Cendant Mobility Financial Corp | $283,000 | -- |
Source: Public Records
Mortgage History
| Date | Status | Borrower | Loan Amount |
|---|---|---|---|
| Open | Gay Linda D | $296,013 | |
| Previous Owner | Davis Robert D | $226,400 | |
| Closed | Davis Robert D | $42,450 |
Source: Public Records
Tax History Compared to Growth
Tax History
| Year | Tax Paid | Tax Assessment Tax Assessment Total Assessment is a certain percentage of the fair market value that is determined by local assessors to be the total taxable value of land and additions on the property. | Land | Improvement |
|---|---|---|---|---|
| 2025 | $4,312 | $292,124 | -- | -- |
| 2024 | $4,312 | $283,891 | -- | -- |
| 2023 | $4,312 | $275,622 | $0 | $0 |
| 2022 | $4,219 | $267,594 | $0 | $0 |
| 2021 | $3,990 | $259,800 | $0 | $0 |
| 2020 | $3,930 | $256,213 | $0 | $0 |
| 2019 | $3,987 | $250,453 | $0 | $0 |
| 2018 | $3,910 | $245,783 | $0 | $0 |
| 2017 | $3,868 | $240,728 | $0 | $0 |
| 2016 | $3,848 | $237,650 | $0 | $0 |
| 2015 | $3,906 | $233,710 | $0 | $0 |
| 2014 | $3,917 | $235,696 | $0 | $0 |
Source: Public Records
Map
Nearby Homes
- 1320 Honeysuckle Dr
- 1571 Lemonwood Rd
- 1416 Lemonwood Rd
- 1104 Creekwood Way N
- 1192 Perregrine Cir W
- 1290 Cunningham Creek Dr
- 1242 Wild Turkey Ct
- 388 Lolly Ln
- 1252 Oakwood Ln
- 1115 Fruit Cove Rd
- 1100 Summerchase Dr
- 1104 Summerchase Dr
- 1304 Hideaway Dr S
- 629 Hummingbird Ct
- 709 Tee Time Ln
- 1166 Harmony Dr N
- 1129 Summerchase Dr
- 1145 Dover Dr
- 1161 Dover Dr
- 129 Hunters Creek Dr
- 1045 Buckbean Branch Ln W
- 1037 Buckbean Branch Ln W
- 1040 Buckbean Branch Ln W
- 1033 Buckbean Branch Ln W
- 1049 Buckbean Branch Ln W
- 1036 Buckbean Branch Ln W
- 1044 Buckbean Branch Ln W
- 1032 Buckbean Branch Ln W
- 1029 Buckbean Branch Ln W
- 1053 Buckbean Branch Ln W
- 1048 Buckbean Branch Ln W
- 961 Dewberry Dr S
- 1028 Buckbean Branch Ln W
- 965 Dewberry Dr S
- 953 Dewberry Dr S
- 1025 Buckbean Branch Ln W
- 1057 Buckbean Branch Ln W
- 969 Dewberry Dr S
- 1024 Buckbean Branch Ln W
- 949 Dewberry Dr S