Estimated Value: $322,000 - $371,000
3
Beds
2
Baths
2,454
Sq Ft
$143/Sq Ft
Est. Value
About This Home
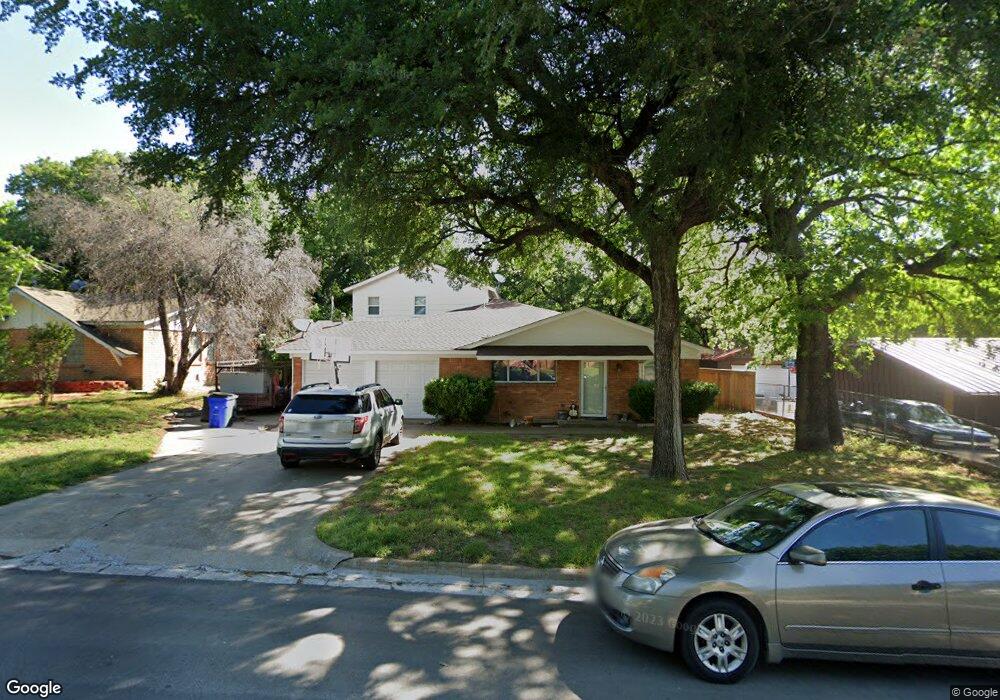
This home is located at 1041 Idlewood Ave, Azle, TX 76020 and is currently estimated at $350,111, approximately $142 per square foot. 1041 Idlewood Ave is a home located in Tarrant County with nearby schools including Eagle Heights Elementary School, Azle Elementary School, and Azle Junior High School.
Ownership History
Date
Name
Owned For
Owner Type
Purchase Details
Closed on
Jun 28, 2013
Sold by
Padgett Marion Kenneth and Padgett Blanca G
Bought by
Morgan Jan
Current Estimated Value
Home Financials for this Owner
Home Financials are based on the most recent Mortgage that was taken out on this home.
Original Mortgage
$86,487
Outstanding Balance
$62,756
Interest Rate
3.87%
Mortgage Type
FHA
Estimated Equity
$287,355
Purchase Details
Closed on
Nov 12, 2004
Sold by
Padgett Marion Kenneth
Bought by
Padgett Marion Kenneth and Padgett Blanca G
Home Financials for this Owner
Home Financials are based on the most recent Mortgage that was taken out on this home.
Original Mortgage
$71,000
Interest Rate
5.72%
Mortgage Type
New Conventional
Purchase Details
Closed on
May 23, 2002
Sold by
Padgett Scott Edward and Padgett Jan Marie
Bought by
Padgett Marion Kenneth
Create a Home Valuation Report for This Property
The Home Valuation Report is an in-depth analysis detailing your home's value as well as a comparison with similar homes in the area
Home Values in the Area
Average Home Value in this Area
Purchase History
| Date | Buyer | Sale Price | Title Company |
|---|---|---|---|
| Morgan Jan | -- | Fidelity National Title | |
| Padgett Marion Kenneth | -- | First Land Title | |
| Padgett Marion Kenneth | -- | Safeco Land Title |
Source: Public Records
Mortgage History
| Date | Status | Borrower | Loan Amount |
|---|---|---|---|
| Open | Morgan Jan | $86,487 | |
| Previous Owner | Padgett Marion Kenneth | $71,000 |
Source: Public Records
Tax History Compared to Growth
Tax History
| Year | Tax Paid | Tax Assessment Tax Assessment Total Assessment is a certain percentage of the fair market value that is determined by local assessors to be the total taxable value of land and additions on the property. | Land | Improvement |
|---|---|---|---|---|
| 2025 | $4,997 | $354,619 | $35,550 | $319,069 |
| 2024 | $4,997 | $354,619 | $35,550 | $319,069 |
| 2023 | $5,480 | $335,392 | $35,550 | $299,842 |
| 2022 | $5,728 | $272,955 | $21,000 | $251,955 |
| 2021 | $5,383 | $294,416 | $21,000 | $273,416 |
| 2020 | $6,364 | $252,340 | $21,000 | $231,340 |
| 2019 | $5,683 | $217,741 | $21,000 | $196,741 |
| 2018 | $4,186 | $160,380 | $21,000 | $139,380 |
| 2017 | $4,030 | $159,369 | $21,000 | $138,369 |
| 2016 | $3,638 | $143,872 | $21,000 | $122,872 |
| 2015 | $3,323 | $131,200 | $21,000 | $110,200 |
| 2014 | $3,323 | $131,200 | $21,000 | $110,200 |
Source: Public Records
Map
Nearby Homes
- 1031 Meadow Wood Terrace
- 413 Glenhaven Dr
- 936 Southeast Pkwy
- 409 Corriente Trail
- 100 Valle Ct
- 108 Bosque Ct
- 113 Hankins Dr
- 117 Redbird Ln N
- 305 Familia Ct
- 356 Shoreline Dr
- 372 Shoreline Dr
- 205 Oregon Ave
- 217 Ridgeway Ave
- 1320 Craft Farms Cir
- 717 Mary Lou
- 233 Victoria Ave
- 300 Shoreline Dr
- 900 Silver Creek Azle Rd
- 1016 Silver Creek Azle Rd
- 1548 Park St
- 1037 Idlewood Ave
- 1045 Idlewood Ave
- 1040 Ferndale Ave
- 1033 Idlewood Ave
- 1036 Ferndale Ave
- 1044 Ferndale Ave
- 1049 Idlewood Ave
- 125 Skylark Dr
- 1040 Idlewood Ave
- 1032 Ferndale Ave
- 1036 Idlewood Ave
- 1044 Idlewood Ave
- 1029 Idlewood Ave
- 1048 Ferndale Ave
- 1032 Idlewood Ave
- 1048 Idlewood Ave
- 1028 Ferndale Ave
- 1028 Idlewood Ave
- 1025 Idlewood Ave
- 1024 Ferndale Ave