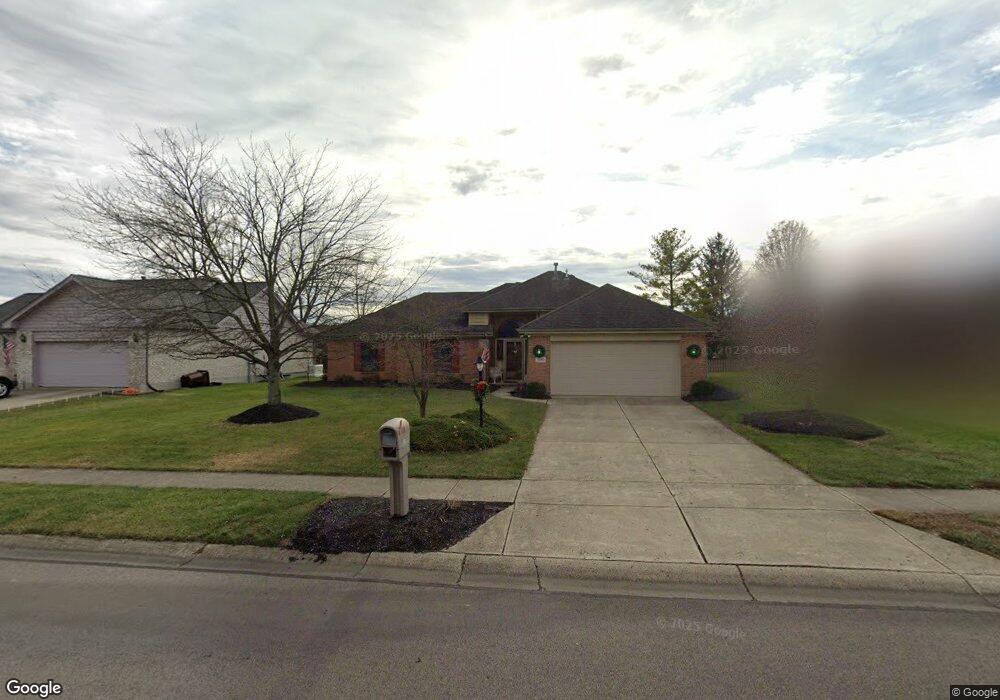
1041 Justin Ridge Way Waynesville, OH 45068
Wayne Township NeighborhoodEstimated Value: $298,632 - $363,000
3
Beds
2
Baths
1,601
Sq Ft
$213/Sq Ft
Est. Value
About This Home
This home is located at 1041 Justin Ridge Way, Waynesville, OH 45068 and is currently estimated at $340,658, approximately $212 per square foot. 1041 Justin Ridge Way is a home located in Warren County with nearby schools including Waynesville Elementary School, Waynesville Middle School, and Waynesville High School.
Ownership History
Date
Name
Owned For
Owner Type
Purchase Details
Closed on
Aug 28, 2013
Sold by
Colvin Nancy J
Bought by
Colvin Nancy J and Nancy J Colvin Living Trust
Current Estimated Value
Purchase Details
Closed on
Mar 8, 2013
Sold by
Kruse Margie L
Bought by
Colvin Kenneth L and Colvin Nancy J
Purchase Details
Closed on
Feb 11, 1997
Sold by
Smith Curtis D
Bought by
Kruse Timothy P and Kruse Margle L
Home Financials for this Owner
Home Financials are based on the most recent Mortgage that was taken out on this home.
Original Mortgage
$80,000
Interest Rate
7.73%
Mortgage Type
New Conventional
Purchase Details
Closed on
Aug 9, 1995
Sold by
Peth Nicholas A
Bought by
P Smith Curtis D and P Smith Denise L
Home Financials for this Owner
Home Financials are based on the most recent Mortgage that was taken out on this home.
Original Mortgage
$112,500
Interest Rate
7.51%
Mortgage Type
New Conventional
Create a Home Valuation Report for This Property
The Home Valuation Report is an in-depth analysis detailing your home's value as well as a comparison with similar homes in the area
Home Values in the Area
Average Home Value in this Area
Purchase History
| Date | Buyer | Sale Price | Title Company |
|---|---|---|---|
| Colvin Nancy J | -- | None Available | |
| Colvin Kenneth L | $164,000 | Prodigy Title Agency | |
| Kruse Timothy P | $125,000 | -- | |
| P Smith Curtis D | $118,430 | -- |
Source: Public Records
Mortgage History
| Date | Status | Borrower | Loan Amount |
|---|---|---|---|
| Previous Owner | Kruse Timothy P | $80,000 | |
| Previous Owner | P Smith Curtis D | $112,500 |
Source: Public Records
Tax History Compared to Growth
Tax History
| Year | Tax Paid | Tax Assessment Tax Assessment Total Assessment is a certain percentage of the fair market value that is determined by local assessors to be the total taxable value of land and additions on the property. | Land | Improvement |
|---|---|---|---|---|
| 2024 | $3,384 | $87,190 | $24,500 | $62,690 |
| 2023 | $3,015 | $68,586 | $12,915 | $55,671 |
| 2022 | $2,956 | $68,586 | $12,915 | $55,671 |
| 2021 | $2,848 | $68,586 | $12,915 | $55,671 |
| 2020 | $2,605 | $55,762 | $10,500 | $45,262 |
| 2019 | $2,607 | $55,762 | $10,500 | $45,262 |
| 2018 | $2,607 | $55,762 | $10,500 | $45,262 |
| 2017 | $2,495 | $50,740 | $10,164 | $40,576 |
| 2016 | $2,346 | $50,740 | $10,164 | $40,576 |
| 2015 | $2,350 | $50,740 | $10,164 | $40,576 |
| 2014 | $2,424 | $45,300 | $9,080 | $36,230 |
| 2013 | $2,161 | $52,410 | $10,500 | $41,910 |
Source: Public Records
Map
Nearby Homes
- 1036 Bayberry Dr
- 1198 Lytle Rd
- 1106 Brookfield Dr Unit 1106
- 1106 Lytle Rd
- 60 E Ellis Dr
- 363 Victoria Place
- 350 Somerset Ln
- 460 Miami St
- 53 S 4th St
- 437 N Main St
- 196 S 3rd St
- 1 Cumberland Ct
- 155 S Main St
- 7219 N Route 42
- 7219 U S 42
- 3950 E State Route 73
- 0 Ohio 73 Unit 944080
- 7219 N Us Rt 42
- 401 Wilkerson Ln
- 8519 Old Stage Rd
- 1055 Justin Ridge Way
- 1033 Justin Ridge Way
- 1048 Crede Way
- 1052 Crede Way
- 1027 Justin Ridge Way
- 1061 Justin Ridge Way
- 1042 Crede Way
- 1046 Justin Ridge Way
- 1038 Justin Ridge Way
- 1060 Crede Way
- 1030 Justin Ridge Way
- 1058 Justin Ridge Way
- 1030 Crede Way
- 1067 Justin Ridge Way
- 1015 Justin Ridge Way
- 1068 Crede Way
- 1022 Justin Ridge Way
- 1064 Justin Ridge Way
- 1026 Crede Way
- 1049 Crede Way