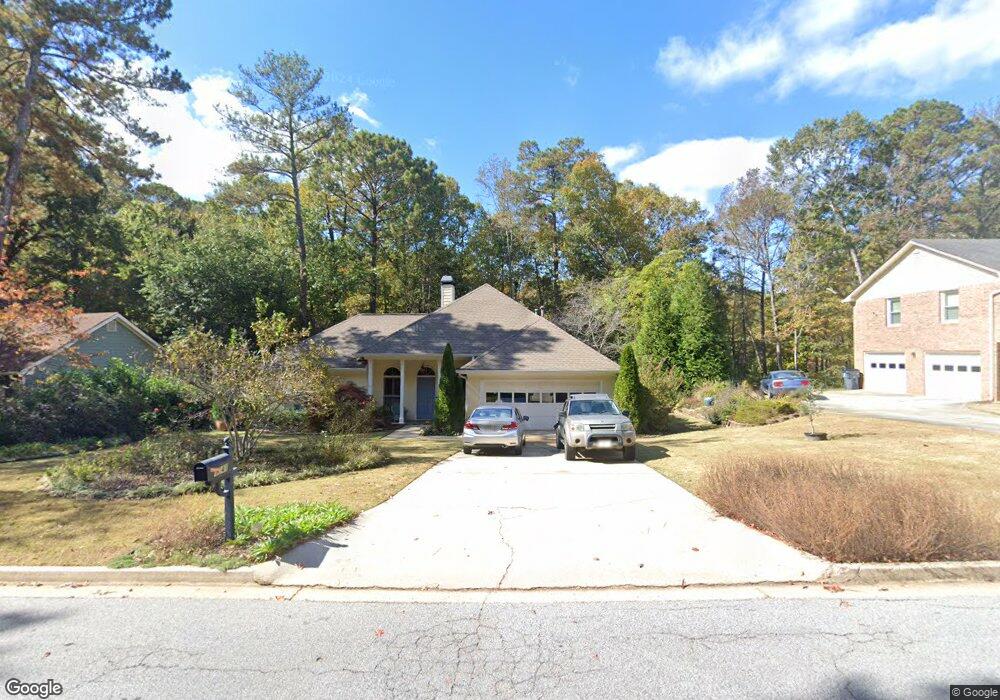
1041 Plantation Blvd SE Conyers, GA 30094
Estimated Value: $258,000 - $289,000
3
Beds
2
Baths
1,418
Sq Ft
$190/Sq Ft
Est. Value
About This Home
This home is located at 1041 Plantation Blvd SE, Conyers, GA 30094 and is currently estimated at $269,412, approximately $189 per square foot. 1041 Plantation Blvd SE is a home located in Rockdale County with nearby schools including Barksdale Elementary School, Gen. Ray Davis Middle School, and Salem High School.
Ownership History
Date
Name
Owned For
Owner Type
Purchase Details
Closed on
May 8, 2018
Sold by
Bammel Michelle L
Bought by
Todd Bobby W and Todd Susan C
Current Estimated Value
Purchase Details
Closed on
Jun 12, 2001
Sold by
Lince Shannon P
Bought by
Bammel Michelle L
Home Financials for this Owner
Home Financials are based on the most recent Mortgage that was taken out on this home.
Original Mortgage
$128,750
Interest Rate
7.17%
Mortgage Type
VA
Purchase Details
Closed on
Sep 8, 2000
Sold by
Coffman John E and Coffman Cleo
Bought by
Lince Shannon P
Home Financials for this Owner
Home Financials are based on the most recent Mortgage that was taken out on this home.
Original Mortgage
$89,320
Interest Rate
8.11%
Mortgage Type
New Conventional
Create a Home Valuation Report for This Property
The Home Valuation Report is an in-depth analysis detailing your home's value as well as a comparison with similar homes in the area
Home Values in the Area
Average Home Value in this Area
Purchase History
| Date | Buyer | Sale Price | Title Company |
|---|---|---|---|
| Todd Bobby W | $158,850 | -- | |
| Bammel Michelle L | $125,000 | -- | |
| Lince Shannon P | $127,600 | -- |
Source: Public Records
Mortgage History
| Date | Status | Borrower | Loan Amount |
|---|---|---|---|
| Previous Owner | Bammel Michelle L | $128,750 | |
| Previous Owner | Lince Shannon P | $89,320 |
Source: Public Records
Tax History Compared to Growth
Tax History
| Year | Tax Paid | Tax Assessment Tax Assessment Total Assessment is a certain percentage of the fair market value that is determined by local assessors to be the total taxable value of land and additions on the property. | Land | Improvement |
|---|---|---|---|---|
| 2024 | $2,171 | $118,080 | $27,680 | $90,400 |
| 2023 | $1,885 | $111,960 | $28,840 | $83,120 |
| 2022 | $1,640 | $90,120 | $23,120 | $67,000 |
| 2021 | $1,490 | $80,840 | $21,520 | $59,320 |
| 2020 | $1,214 | $71,280 | $14,520 | $56,760 |
| 2019 | $880 | $59,120 | $11,520 | $47,600 |
| 2018 | $936 | $44,680 | $7,560 | $37,120 |
| 2017 | $854 | $41,680 | $8,120 | $33,560 |
| 2016 | $757 | $40,560 | $14,760 | $25,800 |
| 2015 | $530 | $32,640 | $6,840 | $25,800 |
| 2014 | $493 | $33,200 | $6,840 | $26,360 |
| 2013 | -- | $41,960 | $8,000 | $33,960 |
Source: Public Records
Map
Nearby Homes
- 1038 Plantation Blvd SE
- 1061 Plantation Blvd SE
- 1023 Plantation Ct SE
- 1119 Plantation Dr SE
- 385 Oglesby Bridge Rd SE
- 550 Oglesby Bridge Rd SE
- 495 Oglesby Bridge Rd SE
- 510 Bell Rd SE Unit 1
- 303 Landon Dr SE
- 570 Bell Rd SE
- 246 Bridgewood Dr SE
- 4797 Hemlock Dr SE
- 604 Hamlet Ct SE
- 455 Sweet Water Trail SE
- 605 Trophy Ln
- 210 Cowan Rd SE
- 4530 Wentworth Place SW
- 4275 Troupe Smith Rd SE
- 411 Willow Ct SE Unit 3
- 1039 Plantation Blvd SE
- 1043 Plantation Blvd SE
- 1045 Plantation Blvd SE
- 1047 Plantation Blvd SE
- 1108 Plantation Dr SE
- 1106 Plantation Dr SE
- 1040 Plantation Blvd SE
- 1036 Plantation Blvd SE
- 1104 Plantation Dr SE
- 1042 Plantation Blvd SE
- 1110 Plantation Dr SE
- 1034 Plantation Blvd SE
- 1112 Plantation Dr SE
- 1049 Plantation Blvd SE
- 1102 Plantation Dr SE
- 1044 Plantation Blvd SE
- 1114 Plantation Dr SE
- 1032 Plantation Blvd SE
- 1057 Plantation Way SE
- 1051 Plantation Blvd SE