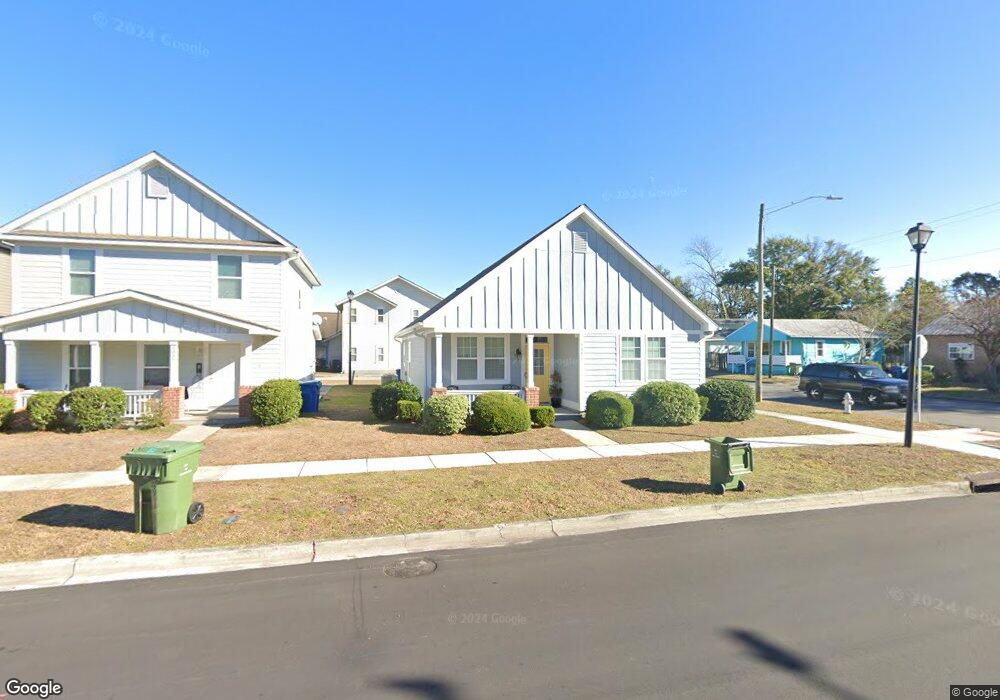
1041 S 8th St Wilmington, NC 28401
Dry Pond-South Side NeighborhoodEstimated Value: $247,000 - $285,000
2
Beds
2
Baths
1,190
Sq Ft
$224/Sq Ft
Est. Value
About This Home
This home is located at 1041 S 8th St, Wilmington, NC 28401 and is currently estimated at $266,935, approximately $224 per square foot. 1041 S 8th St is a home located in New Hanover County with nearby schools including Forest Hills Global Elementary School, Myrtle Grove Middle School, and John T. Hoggard High School.
Ownership History
Date
Name
Owned For
Owner Type
Purchase Details
Closed on
Nov 23, 2009
Sold by
Housing Authority Of The City Of Wilming
Bought by
David Kariba L
Current Estimated Value
Home Financials for this Owner
Home Financials are based on the most recent Mortgage that was taken out on this home.
Original Mortgage
$48,000
Outstanding Balance
$31,310
Interest Rate
4.98%
Mortgage Type
New Conventional
Estimated Equity
$235,625
Create a Home Valuation Report for This Property
The Home Valuation Report is an in-depth analysis detailing your home's value as well as a comparison with similar homes in the area
Home Values in the Area
Average Home Value in this Area
Purchase History
| Date | Buyer | Sale Price | Title Company |
|---|---|---|---|
| David Kariba L | $115,000 | None Available |
Source: Public Records
Mortgage History
| Date | Status | Borrower | Loan Amount |
|---|---|---|---|
| Open | David Kariba L | $48,000 |
Source: Public Records
Tax History Compared to Growth
Tax History
| Year | Tax Paid | Tax Assessment Tax Assessment Total Assessment is a certain percentage of the fair market value that is determined by local assessors to be the total taxable value of land and additions on the property. | Land | Improvement |
|---|---|---|---|---|
| 2025 | $572 | $279,800 | $83,800 | $196,000 |
| 2023 | $572 | $131,600 | $35,800 | $95,800 |
| 2022 | $559 | $131,600 | $35,800 | $95,800 |
| 2021 | $563 | $131,600 | $35,800 | $95,800 |
| 2020 | $544 | $103,300 | $31,800 | $71,500 |
| 2019 | $544 | $103,300 | $31,800 | $71,500 |
| 2018 | $544 | $103,300 | $31,800 | $71,500 |
| 2017 | $544 | $103,300 | $31,800 | $71,500 |
| 2016 | $647 | $116,800 | $12,900 | $103,900 |
| 2015 | $618 | $116,800 | $12,900 | $103,900 |
| 2014 | $592 | $116,800 | $12,900 | $103,900 |
Source: Public Records
Map
Nearby Homes