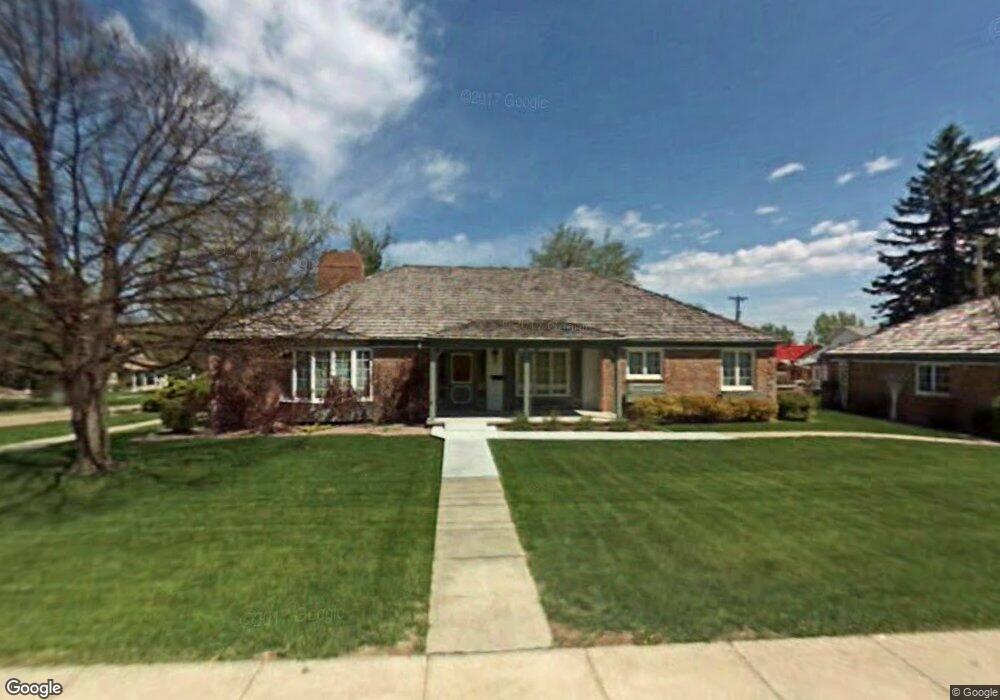
1041 S H St Broken Bow, NE 68822
Estimated Value: $169,000 - $236,593
Studio
2
Baths
1,928
Sq Ft
$107/Sq Ft
Est. Value
About This Home
This home is located at 1041 S H St, Broken Bow, NE 68822 and is currently estimated at $206,148, approximately $106 per square foot. 1041 S H St is a home located in Custer County with nearby schools including North Park Elementary School, Broken Bow Junior High School, and Broken Bow High School.
Ownership History
Date
Name
Owned For
Owner Type
Purchase Details
Closed on
Jan 3, 2013
Sold by
Kulhanek Leslie D and Kulhanek Melissa A
Bought by
Kulhanek Leslie Dean
Current Estimated Value
Purchase Details
Closed on
Dec 9, 2010
Sold by
Mcginn Shirley S
Bought by
Kulhanek Leslie D and Kulhanek Melissa A
Purchase Details
Closed on
Mar 29, 2010
Sold by
Mcginn Shirley S Etal
Bought by
Mcginn Shirley S
Purchase Details
Closed on
Mar 26, 2010
Sold by
Schmitz Lucile
Bought by
Mcginn Shirley S
Create a Home Valuation Report for This Property
The Home Valuation Report is an in-depth analysis detailing your home's value as well as a comparison with similar homes in the area
Home Values in the Area
Average Home Value in this Area
Purchase History
| Date | Buyer | Sale Price | Title Company |
|---|---|---|---|
| Kulhanek Leslie Dean | -- | -- | |
| Kulhanek Leslie D | $150,000 | -- | |
| Mcginn Shirley S | $80,000 | -- | |
| Mcginn Shirley S | -- | -- |
Source: Public Records
Tax History
| Year | Tax Paid | Tax Assessment Tax Assessment Total Assessment is a certain percentage of the fair market value that is determined by local assessors to be the total taxable value of land and additions on the property. | Land | Improvement |
|---|---|---|---|---|
| 2025 | $3,181 | $249,078 | $10,752 | $238,326 |
| 2024 | $2,906 | $213,730 | $10,752 | $202,978 |
| 2023 | $3,177 | $202,789 | $10,752 | $192,037 |
| 2022 | $3,297 | $179,625 | $10,752 | $168,873 |
| 2021 | $3,210 | $178,953 | $10,080 | $168,873 |
| 2020 | $3,183 | $178,953 | $10,080 | $168,873 |
| 2019 | $3,134 | $176,495 | $5,041 | $171,454 |
| 2017 | $3,202 | $175,362 | $5,041 | $170,321 |
| 2016 | $3,469 | $173,614 | $3,293 | $170,321 |
| 2015 | $3,297 | $163,616 | $3,251 | $160,365 |
| 2014 | $3,297 | $148,741 | $2,955 | $145,786 |
Source: Public Records
Map
Nearby Homes
Your Personal Tour Guide
Ask me questions while you tour the home.