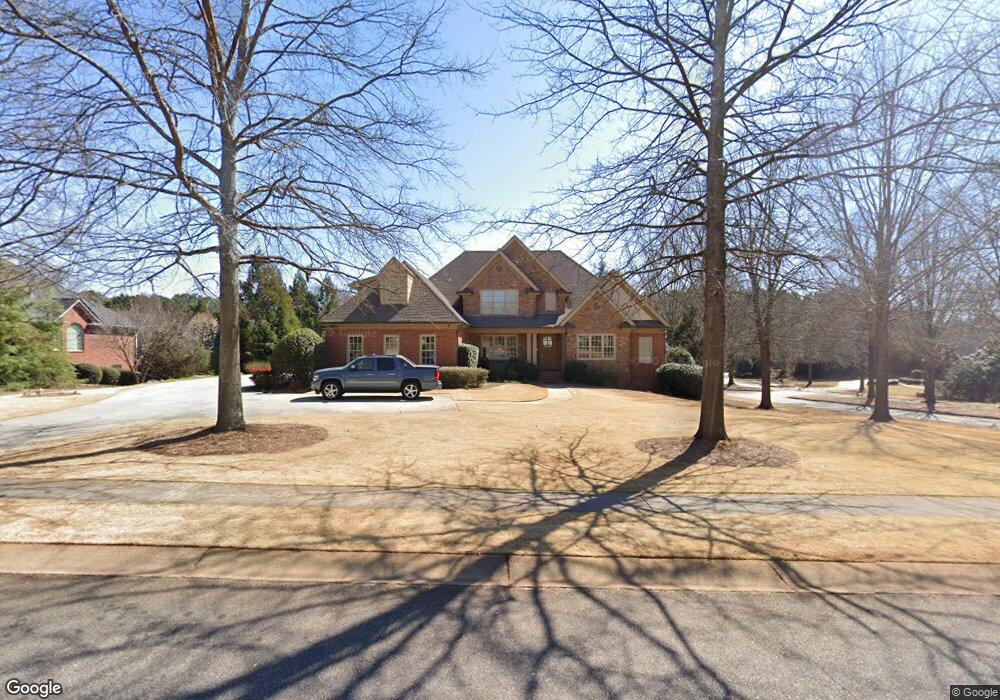
1041 Waverly Meadow Ln Bogart, GA 30622
Estimated Value: $1,065,000 - $1,287,000
--
Bed
--
Bath
4,461
Sq Ft
$261/Sq Ft
Est. Value
About This Home
This home is located at 1041 Waverly Meadow Ln, Bogart, GA 30622 and is currently estimated at $1,163,642, approximately $260 per square foot. 1041 Waverly Meadow Ln is a home located in Oconee County with nearby schools including Oconee County Elementary School, Oconee County Primary School, and Oconee County Middle School.
Ownership History
Date
Name
Owned For
Owner Type
Purchase Details
Closed on
May 21, 2008
Sold by
Not Provided
Bought by
Patton Rodney L and Patton Catherine R
Current Estimated Value
Home Financials for this Owner
Home Financials are based on the most recent Mortgage that was taken out on this home.
Original Mortgage
$496,850
Interest Rate
6%
Mortgage Type
New Conventional
Purchase Details
Closed on
May 6, 2005
Sold by
Mitch Mullis Builders Inc
Bought by
Patton Rodney L
Purchase Details
Closed on
Apr 1, 2005
Sold by
B & J Custom Homes Inc
Bought by
Mitch Mullis Builders Inc
Create a Home Valuation Report for This Property
The Home Valuation Report is an in-depth analysis detailing your home's value as well as a comparison with similar homes in the area
Home Values in the Area
Average Home Value in this Area
Purchase History
| Date | Buyer | Sale Price | Title Company |
|---|---|---|---|
| Patton Rodney L | -- | -- | |
| Patton Rodney L | $100,000 | -- | |
| Mitch Mullis Builders Inc | -- | -- |
Source: Public Records
Mortgage History
| Date | Status | Borrower | Loan Amount |
|---|---|---|---|
| Closed | Patton Rodney L | $496,850 |
Source: Public Records
Tax History Compared to Growth
Tax History
| Year | Tax Paid | Tax Assessment Tax Assessment Total Assessment is a certain percentage of the fair market value that is determined by local assessors to be the total taxable value of land and additions on the property. | Land | Improvement |
|---|---|---|---|---|
| 2024 | $7,809 | $420,247 | $36,000 | $384,247 |
| 2023 | $7,857 | $394,117 | $28,000 | $366,117 |
| 2022 | $7,559 | $352,362 | $28,000 | $324,362 |
| 2021 | $7,513 | $324,711 | $28,000 | $296,711 |
| 2020 | $7,112 | $306,906 | $28,000 | $278,906 |
| 2019 | $6,899 | $297,742 | $28,000 | $269,742 |
| 2018 | $6,342 | $267,959 | $28,000 | $239,959 |
| 2017 | $6,345 | $268,105 | $28,000 | $240,105 |
| 2016 | $5,963 | $251,975 | $28,000 | $223,975 |
| 2015 | $6,394 | $269,604 | $36,000 | $233,604 |
| 2014 | $6,332 | $260,991 | $36,000 | $224,991 |
| 2013 | -- | $261,756 | $44,000 | $217,756 |
Source: Public Records
Map
Nearby Homes
- 1010 Springview Ct
- 1231 Founders Lake Dr
- 1621 Daniells Bridge Rd
- 1050 Chestnut Glen
- 1011 Magnolia Dr
- 1080 Barber Creek Dr
- 1091 Barber Creek Dr
- 1051 Riverhaven Ln
- 1020 Barber Creek Dr Unit 211
- 1340 Old Epps Bridge Rd
- 1271 Daniells Bridge Rd
- 3065 Meadow Springs Dr
- 2481 Lakewood Manor Dr
- 165 Canterbury Dr
- 2550 Hodges Mill Rd
- 1021 Steeple Chase Ct
- 1271 Daandra Dr
- 160 Edgewood Dr
- 1120 Creekshore Dr
- 1130 Creekshore Dr
- 1151 Creekshore Dr
- 1181 Twin Lakes Rd
- 1110 Creekshore Dr
- 1140 Creekshore Dr
- 1061 Creekshore Dr
- 1111 Settlers Ridge Rd
- 1171 Twin Lakes Rd
- 1121 Settlers Ridge Rd
- 1161 Creekshore Dr
- 1231 Twin Lakes Rd
- 1160 Creekshore Dr
- 1151 Twin Lakes Rd
- 1131 Settlers Ridge Rd
- 1341 Twin Lakes Rd
- 1181 Creekshore Dr
- 1120 Settlers Ridge Rd
- 1200 Twin Lakes Rd
- 0 Creekshore Dr Unit 8139638