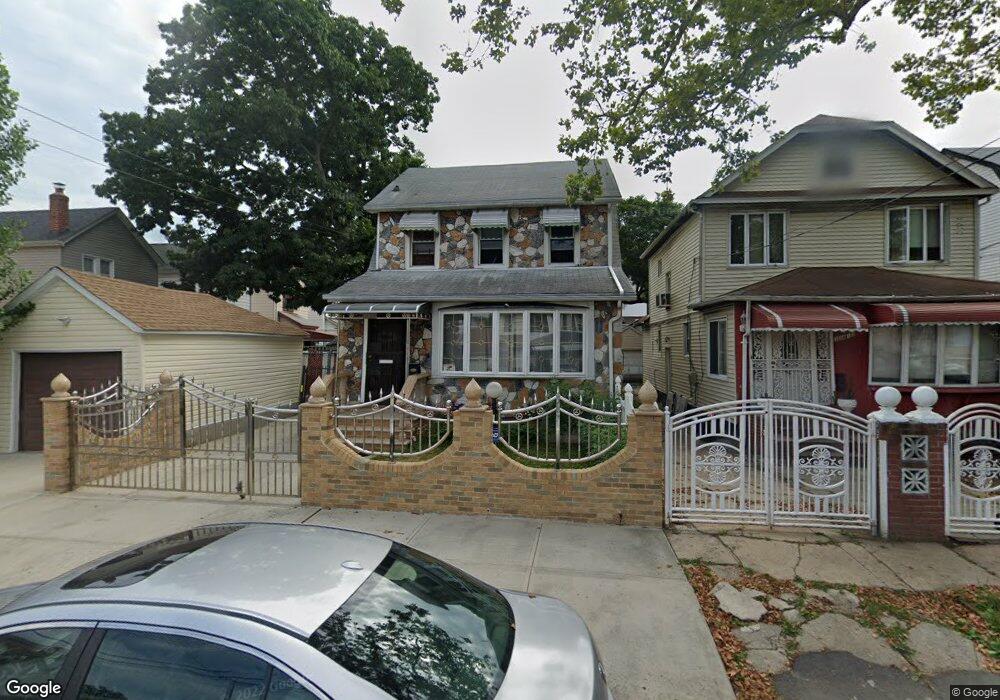
10411 202nd St Saint Albans, NY 11412
Hollis NeighborhoodEstimated Value: $750,916 - $802,000
--
Bed
--
Bath
1,738
Sq Ft
$444/Sq Ft
Est. Value
About This Home
This home is located at 10411 202nd St, Saint Albans, NY 11412 and is currently estimated at $771,729, approximately $444 per square foot. 10411 202nd St is a home located in Queens County with nearby schools including P.S. 134 Langston Hughes School, I.S. 192 The Linden, and Wellspring Elementary & Middle.
Ownership History
Date
Name
Owned For
Owner Type
Purchase Details
Closed on
Jun 30, 2008
Sold by
Johnson Ethel and Johnson Tabitha
Bought by
Ramoutar Bheesham and Ramoutar Hemawattie
Current Estimated Value
Home Financials for this Owner
Home Financials are based on the most recent Mortgage that was taken out on this home.
Original Mortgage
$389,500
Outstanding Balance
$252,041
Interest Rate
6.13%
Mortgage Type
Purchase Money Mortgage
Estimated Equity
$519,688
Purchase Details
Closed on
Mar 10, 2006
Sold by
Harvin Reginald and Johnson Ethel
Bought by
Johnson Ethel and Johnson Tabitha
Purchase Details
Closed on
Aug 29, 2001
Sold by
Cato Ralph and Cato Catherine
Bought by
Johnson Ethel and Harvin Reginald
Home Financials for this Owner
Home Financials are based on the most recent Mortgage that was taken out on this home.
Original Mortgage
$247,000
Interest Rate
6.77%
Create a Home Valuation Report for This Property
The Home Valuation Report is an in-depth analysis detailing your home's value as well as a comparison with similar homes in the area
Home Values in the Area
Average Home Value in this Area
Purchase History
| Date | Buyer | Sale Price | Title Company |
|---|---|---|---|
| Ramoutar Bheesham | $410,000 | -- | |
| Ramoutar Bheesham | $410,000 | -- | |
| Johnson Ethel | -- | -- | |
| Johnson Ethel | -- | -- | |
| Johnson Ethel | -- | -- | |
| Johnson Ethel | -- | -- |
Source: Public Records
Mortgage History
| Date | Status | Borrower | Loan Amount |
|---|---|---|---|
| Open | Ramoutar Bheesham | $389,500 | |
| Closed | Ramoutar Bheesham | $389,500 | |
| Previous Owner | Johnson Ethel | $247,000 | |
| Closed | Johnson Ethel | $0 |
Source: Public Records
Tax History Compared to Growth
Tax History
| Year | Tax Paid | Tax Assessment Tax Assessment Total Assessment is a certain percentage of the fair market value that is determined by local assessors to be the total taxable value of land and additions on the property. | Land | Improvement |
|---|---|---|---|---|
| 2025 | $5,783 | $31,999 | $7,468 | $24,531 |
| 2024 | $5,795 | $30,191 | $8,445 | $21,746 |
| 2023 | $5,440 | $28,483 | $7,946 | $20,537 |
| 2022 | $5,078 | $37,080 | $12,420 | $24,660 |
| 2021 | $5,359 | $35,340 | $12,420 | $22,920 |
| 2020 | $5,348 | $36,240 | $12,420 | $23,820 |
| 2019 | $4,970 | $33,960 | $12,420 | $21,540 |
| 2018 | $4,541 | $23,736 | $9,377 | $14,359 |
| 2017 | $4,265 | $22,394 | $9,617 | $12,777 |
| 2016 | $4,167 | $22,394 | $9,617 | $12,777 |
| 2015 | $2,328 | $22,222 | $12,405 | $9,817 |
| 2014 | $2,328 | $20,966 | $13,248 | $7,718 |
Source: Public Records
Map
Nearby Homes
- 204-20 104th Ave
- 104-38 202nd St
- 204-06 109th Ave
- 20202 109th Ave
- 104-28 201st St
- 10411 200th St
- 200-21 Hollis Ave
- 109-12 Francis Lewis Blvd
- 104-39 199th St
- 10967 203rd St
- 19920 Hollis Ave
- 100-28 207th St
- 100-32 199th St
- 99-11 200th St
- 10445 198th St
- 19907 100th Ave
- 205-28 110th Ave
- 10925 208th St
- 109-87 Francis Lewis Blvd
- 110-22 207th St
- 10415 202nd St
- 104-15 202nd St
- 10417 202nd St
- 20206 104th Ave
- 20204 104th Ave
- 20208 104th Ave
- 20202 104th Ave
- 20212 104th Ave
- 10419 202nd St
- 10412 203rd St
- 10414 203rd St
- 10412 203rd St
- 20214 104th Ave
- 202-14 104th Ave
- 10418 203rd St
- 202-07 104th Ave
- 10423 202nd St
- 104-30 202nd St
- 20216 104th Ave
- 10420 203rd St