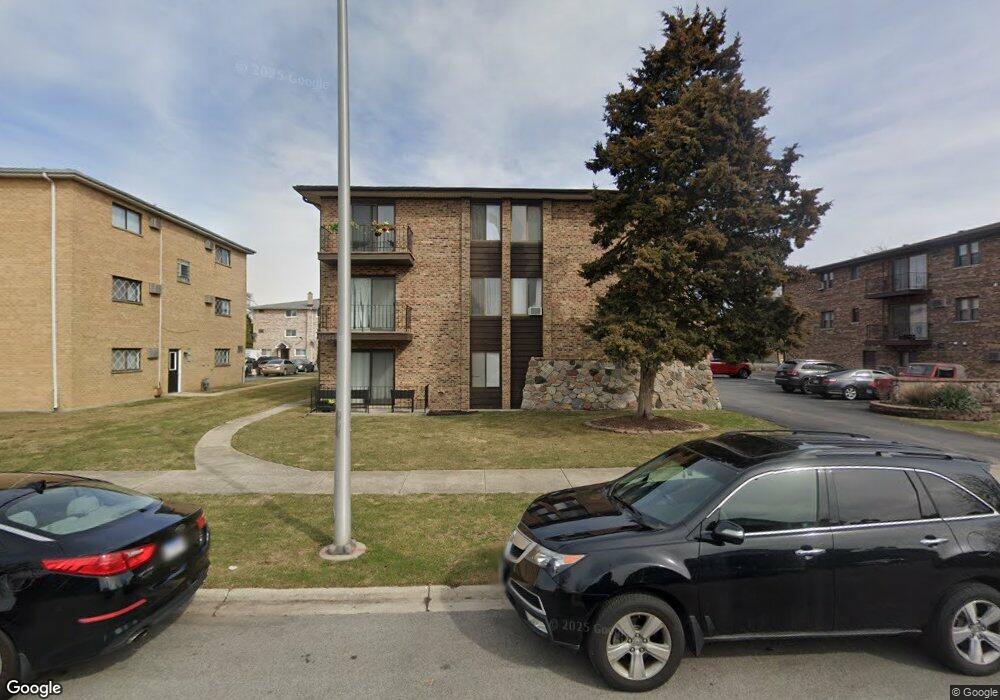
10411 Mason Ave Unit 3 Oak Lawn, IL 60453
Estimated Value: $127,919 - $139,000
1
Bed
1
Bath
800
Sq Ft
$169/Sq Ft
Est. Value
About This Home
This home is located at 10411 Mason Ave Unit 3, Oak Lawn, IL 60453 and is currently estimated at $135,480, approximately $169 per square foot. 10411 Mason Ave Unit 3 is a home located in Cook County with nearby schools including Ridge Lawn Elementary School, Elden D Finley Jr High School, and Harold L. Richards High School.
Ownership History
Date
Name
Owned For
Owner Type
Purchase Details
Closed on
Mar 28, 2017
Sold by
Christianson Kenneth and Temaner Lou
Bought by
Rtl Entrprices Llc
Current Estimated Value
Purchase Details
Closed on
Sep 26, 2003
Sold by
Heitz Jeffrey D
Bought by
Christianson Kenneth
Home Financials for this Owner
Home Financials are based on the most recent Mortgage that was taken out on this home.
Original Mortgage
$75,762
Interest Rate
6.23%
Mortgage Type
Purchase Money Mortgage
Purchase Details
Closed on
Mar 19, 2002
Sold by
Postacchini Stefano
Bought by
Heitz Jeffery D
Home Financials for this Owner
Home Financials are based on the most recent Mortgage that was taken out on this home.
Original Mortgage
$68,000
Interest Rate
6.95%
Mortgage Type
Purchase Money Mortgage
Purchase Details
Closed on
Aug 15, 1996
Sold by
State Bank Of Countryside
Bought by
Postacchini Stefano
Create a Home Valuation Report for This Property
The Home Valuation Report is an in-depth analysis detailing your home's value as well as a comparison with similar homes in the area
Home Values in the Area
Average Home Value in this Area
Purchase History
| Date | Buyer | Sale Price | Title Company |
|---|---|---|---|
| Rtl Entrprices Llc | $50,000 | None Available | |
| Christianson Kenneth | -- | Pntn | |
| Heitz Jeffery D | $68,000 | First American Title | |
| Postacchini Stefano | $50,000 | -- |
Source: Public Records
Mortgage History
| Date | Status | Borrower | Loan Amount |
|---|---|---|---|
| Previous Owner | Christianson Kenneth | $75,762 | |
| Previous Owner | Heitz Jeffery D | $68,000 |
Source: Public Records
Tax History Compared to Growth
Tax History
| Year | Tax Paid | Tax Assessment Tax Assessment Total Assessment is a certain percentage of the fair market value that is determined by local assessors to be the total taxable value of land and additions on the property. | Land | Improvement |
|---|---|---|---|---|
| 2024 | $2,255 | $7,713 | $992 | $6,721 |
| 2023 | $1,452 | $7,713 | $992 | $6,721 |
| 2022 | $1,452 | $3,999 | $884 | $3,115 |
| 2021 | $1,403 | $3,999 | $884 | $3,115 |
| 2020 | $1,563 | $4,473 | $884 | $3,589 |
| 2019 | $1,396 | $3,796 | $804 | $2,992 |
| 2018 | $2,509 | $7,157 | $804 | $6,353 |
| 2017 | $1,342 | $7,157 | $804 | $6,353 |
| 2016 | $973 | $5,060 | $664 | $4,396 |
| 2015 | $912 | $5,060 | $664 | $4,396 |
| 2014 | $918 | $5,060 | $664 | $4,396 |
| 2013 | $1,216 | $6,258 | $664 | $5,594 |
Source: Public Records
Map
Nearby Homes
- 10429 Austin Ave Unit A
- 10330 Mayfield Ave Unit 2N
- 10301 Mcvicker Ave
- 10529 Lyman Ave
- 6027 103rd St Unit 1
- 10355 Menard Ave Unit 216
- 10420 Circle Dr Unit 25B
- 10420 Circle Dr Unit 22B
- 6131 Marshall Ave Unit 1W
- 10400 Circle Dr Unit 102
- 5700 Circle Dr Unit 101
- 5633 Edge Lake Dr
- 5810 107th Court Way
- 10308 Circle Dr Unit 301
- 10364 Parkside Ave Unit C1
- 10510 Parkside Ave Unit 7
- 10510 Parkside Ave Unit 1
- 5621 W 104th St Unit B2
- 10355 Parkside Ave Unit 4
- 5733 W 101st Place
- 10411 Mason Ave Unit 7
- 10411 Mason Ave Unit G3
- 10411 Mason Ave Unit G5
- 10411 Mason Ave Unit G6
- 10411 Mason Ave Unit G4
- 10411 Mason Ave Unit 2NW
- 10411 Mason Ave Unit G7
- 10411 Mason Ave Unit G2
- 10411 Mason Ave Unit G1
- 10411 Mason Ave Unit 2SE
- 10411 Mason Ave Unit 3NE
- 10411 Mason Ave Unit 3NW
- 10411 Mason Ave Unit 2NE
- 10411 Mason Ave Unit 3SE
- 10411 Mason Ave Unit 3SW
- 10411 Mason Ave Unit 1NE
- 10411 Mason Ave Unit 1NW
- 10411 Mason Ave Unit 2SW
- 10411 Mason Ave Unit 9
- 10411 Mason Ave Unit 5