10413 Manly Chapel Hill, NC 27517
Governors Club NeighborhoodEstimated Value: $1,476,000 - $1,742,000
3
Beds
6
Baths
4,954
Sq Ft
$323/Sq Ft
Est. Value
About This Home
This home is located at 10413 Manly, Chapel Hill, NC 27517 and is currently estimated at $1,601,998, approximately $323 per square foot. 10413 Manly is a home located in Chatham County with nearby schools including North Chatham Elementary School and Margaret B. Pollard Middle School.
Ownership History
Date
Name
Owned For
Owner Type
Purchase Details
Closed on
Mar 26, 2018
Sold by
Hubbard William C and Hubbard Jane J
Bought by
Mcgraw Benjamin F and Mcgraw Shelley C
Current Estimated Value
Home Financials for this Owner
Home Financials are based on the most recent Mortgage that was taken out on this home.
Original Mortgage
$772,000
Outstanding Balance
$657,228
Interest Rate
4.2%
Mortgage Type
Adjustable Rate Mortgage/ARM
Estimated Equity
$944,770
Purchase Details
Closed on
Dec 31, 1996
Bought by
Hubbard William C and Hubbard Jane J
Create a Home Valuation Report for This Property
The Home Valuation Report is an in-depth analysis detailing your home's value as well as a comparison with similar homes in the area
Home Values in the Area
Average Home Value in this Area
Purchase History
| Date | Buyer | Sale Price | Title Company |
|---|---|---|---|
| Mcgraw Benjamin F | $965,000 | None Available | |
| Hubbard William C | -- | -- |
Source: Public Records
Mortgage History
| Date | Status | Borrower | Loan Amount |
|---|---|---|---|
| Open | Mcgraw Benjamin F | $772,000 |
Source: Public Records
Tax History Compared to Growth
Tax History
| Year | Tax Paid | Tax Assessment Tax Assessment Total Assessment is a certain percentage of the fair market value that is determined by local assessors to be the total taxable value of land and additions on the property. | Land | Improvement |
|---|---|---|---|---|
| 2025 | $10,098 | $1,416,163 | $339,680 | $1,076,483 |
| 2024 | $10,098 | $971,493 | $270,585 | $700,908 |
| 2023 | $8,424 | $971,493 | $270,585 | $700,908 |
| 2022 | $7,732 | $971,493 | $270,585 | $700,908 |
| 2021 | $7,635 | $971,493 | $270,585 | $700,908 |
| 2020 | $7,298 | $921,993 | $383,625 | $538,368 |
| 2019 | $7,298 | $921,993 | $383,625 | $538,368 |
| 2018 | $6,225 | $921,993 | $383,625 | $538,368 |
| 2017 | $6,225 | $838,965 | $383,625 | $455,340 |
| 2016 | $6,738 | $902,113 | $412,500 | $489,613 |
| 2015 | $6,630 | $902,113 | $412,500 | $489,613 |
| 2014 | $6,863 | $953,986 | $412,500 | $541,486 |
| 2013 | -- | $953,986 | $412,500 | $541,486 |
Source: Public Records
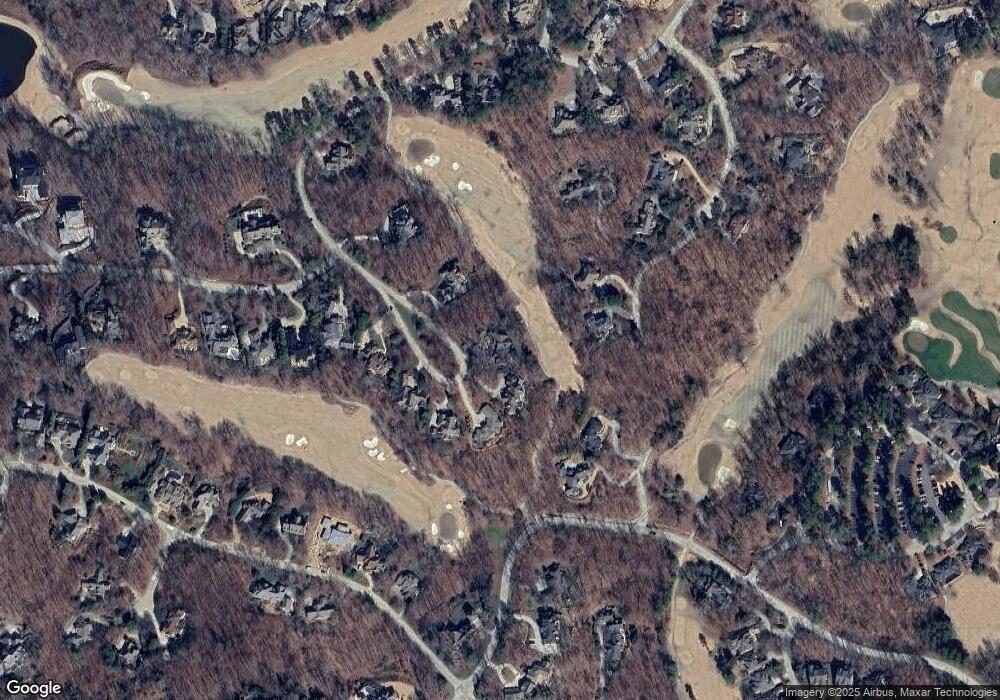
Map
Nearby Homes