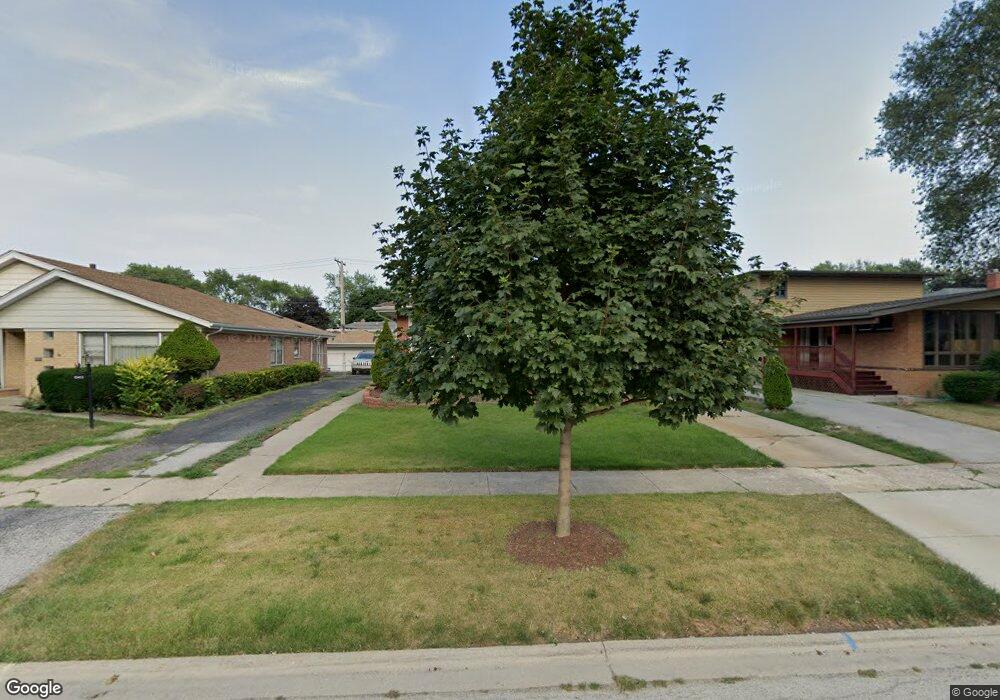
10417 S Keeler Ave Oak Lawn, IL 60453
Estimated Value: $380,000 - $453,000
4
Beds
3
Baths
2,100
Sq Ft
$193/Sq Ft
Est. Value
About This Home
This home is located at 10417 S Keeler Ave, Oak Lawn, IL 60453 and is currently estimated at $406,310, approximately $193 per square foot. 10417 S Keeler Ave is a home located in Cook County with nearby schools including Kolmar Avenue Elementary School, Sward Elementary School, and Hometown Elementary School.
Ownership History
Date
Name
Owned For
Owner Type
Purchase Details
Closed on
Aug 22, 2014
Sold by
Errico Gina M
Bought by
Knight Jeffrey and Night Rhonda
Current Estimated Value
Home Financials for this Owner
Home Financials are based on the most recent Mortgage that was taken out on this home.
Original Mortgage
$258,300
Outstanding Balance
$201,555
Interest Rate
4.75%
Mortgage Type
New Conventional
Estimated Equity
$204,755
Purchase Details
Closed on
May 27, 2011
Sold by
Pelzman Catherine and Pelzman Lesli
Bought by
Errico Gina M
Home Financials for this Owner
Home Financials are based on the most recent Mortgage that was taken out on this home.
Original Mortgage
$232,559
Interest Rate
5.12%
Mortgage Type
FHA
Purchase Details
Closed on
Dec 14, 1993
Sold by
Kelly Janet
Bought by
Kelly Janet
Create a Home Valuation Report for This Property
The Home Valuation Report is an in-depth analysis detailing your home's value as well as a comparison with similar homes in the area
Home Values in the Area
Average Home Value in this Area
Purchase History
| Date | Buyer | Sale Price | Title Company |
|---|---|---|---|
| Knight Jeffrey | $292,000 | Fidelity National Title | |
| Errico Gina M | $205,000 | Chicago Title Insurance Co | |
| Kelly Janet | -- | -- |
Source: Public Records
Mortgage History
| Date | Status | Borrower | Loan Amount |
|---|---|---|---|
| Open | Knight Jeffrey | $258,300 | |
| Previous Owner | Errico Gina M | $232,559 |
Source: Public Records
Tax History Compared to Growth
Tax History
| Year | Tax Paid | Tax Assessment Tax Assessment Total Assessment is a certain percentage of the fair market value that is determined by local assessors to be the total taxable value of land and additions on the property. | Land | Improvement |
|---|---|---|---|---|
| 2024 | $8,574 | $30,000 | $4,620 | $25,380 |
| 2023 | $7,937 | $30,000 | $4,620 | $25,380 |
| 2022 | $7,937 | $23,554 | $3,960 | $19,594 |
| 2021 | $7,759 | $23,554 | $3,960 | $19,594 |
| 2020 | $7,769 | $23,554 | $3,960 | $19,594 |
| 2019 | $7,629 | $23,327 | $3,630 | $19,697 |
| 2018 | $7,342 | $23,327 | $3,630 | $19,697 |
| 2017 | $7,456 | $23,327 | $3,630 | $19,697 |
| 2016 | $7,587 | $21,892 | $2,970 | $18,922 |
| 2015 | $7,426 | $21,892 | $2,970 | $18,922 |
| 2014 | $7,341 | $21,892 | $2,970 | $18,922 |
| 2013 | $6,986 | $23,001 | $2,970 | $20,031 |
Source: Public Records
Map
Nearby Homes
- 10509 Kedvale Ave
- 10420 S Kildare Ave
- 10418 S Pulaski Rd Unit 204C
- 10448 S Pulaski Rd
- 10314 S Komensky Ave Unit 3C
- 3955 W 104th St Unit 2B
- 10207 S Keeler Ave
- 3909 W 104th St
- 10155 S Kildare Ave
- 4000 W 107th St
- 4509 W 105th St
- 10126 S Pulaski Rd Unit P4
- 10728 S Pulaski Rd
- 10713 S Kenneth Ave
- 10100 S Pulaski Rd Unit 1E
- 10036 Kedvale Ave
- 10036 S Tripp Ave
- 10823 S Keeler Ave
- 10511 S Hamlin Ave
- 10048 S Pulaski Rd Unit 2B
- 10413 S Keeler Ave
- 10421 S Keeler Ave
- 10409 S Keeler Ave
- 10425 S Keeler Ave
- 10416 Kedvale Ave
- 10412 Kedvale Ave
- 10420 Kedvale Ave
- 10405 S Keeler Ave
- 10429 S Keeler Ave
- 10408 Kedvale Ave
- 10424 Kedvale Ave
- 10416 S Keeler Ave
- 10404 Kedvale Ave
- 10401 S Keeler Ave
- 10428 Kedvale Ave
- 10433 S Keeler Ave
- 10420 S Keeler Ave
- 10412 S Keeler Ave
- 10424 S Keeler Ave
- 10408 S Keeler Ave