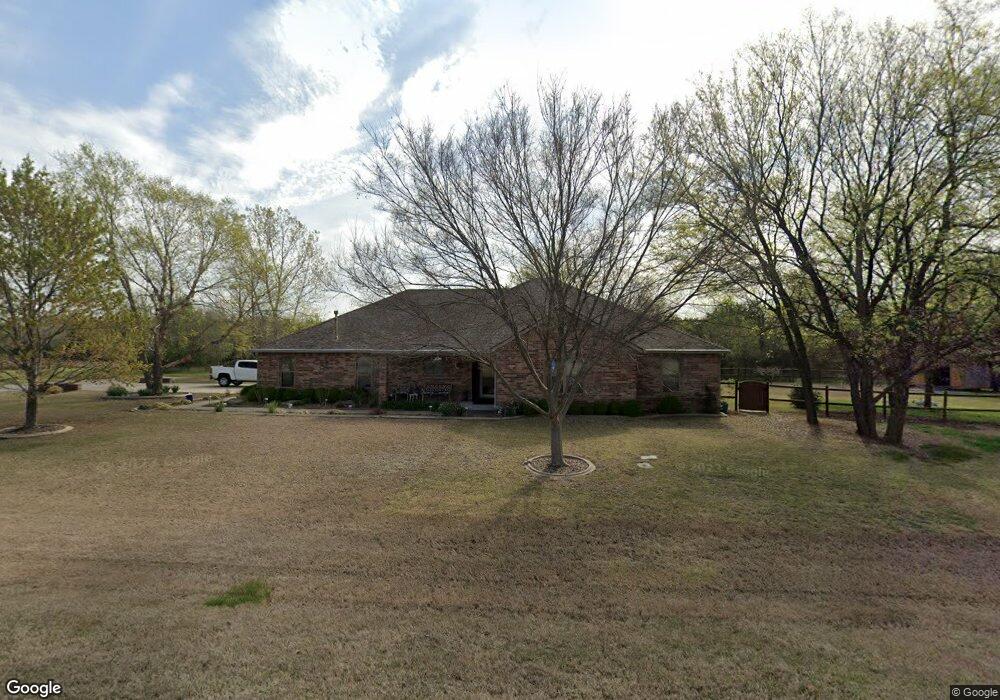
10419 N 90th East Ave Owasso, OK 74055
Estimated Value: $321,000 - $329,000
3
Beds
2
Baths
2,071
Sq Ft
$157/Sq Ft
Est. Value
About This Home
This home is located at 10419 N 90th East Ave, Owasso, OK 74055 and is currently estimated at $325,786, approximately $157 per square foot. 10419 N 90th East Ave is a home located in Tulsa County with nearby schools including Barnes Elementary School, Owasso 6th Grade Center, and Owasso 7th Grade Center.
Ownership History
Date
Name
Owned For
Owner Type
Purchase Details
Closed on
Sep 4, 2014
Sold by
Collins Gary L
Bought by
Coolins Gary L and Weeks Eileen
Current Estimated Value
Purchase Details
Closed on
Jan 31, 2012
Sold by
Collins Gary L and Bradshaw Kimberly
Bought by
Collins Gary L
Home Financials for this Owner
Home Financials are based on the most recent Mortgage that was taken out on this home.
Original Mortgage
$140,000
Outstanding Balance
$95,143
Interest Rate
3.95%
Mortgage Type
New Conventional
Estimated Equity
$230,643
Purchase Details
Closed on
May 15, 2002
Sold by
Amer Lane Homes Inc
Bought by
Collins Gary L and Collins Kimberly
Purchase Details
Closed on
Nov 9, 2001
Sold by
Baker Kight Development Inc
Bought by
Amber Lane Homes Inc
Home Financials for this Owner
Home Financials are based on the most recent Mortgage that was taken out on this home.
Original Mortgage
$112,000
Interest Rate
6.59%
Mortgage Type
Purchase Money Mortgage
Create a Home Valuation Report for This Property
The Home Valuation Report is an in-depth analysis detailing your home's value as well as a comparison with similar homes in the area
Home Values in the Area
Average Home Value in this Area
Purchase History
| Date | Buyer | Sale Price | Title Company |
|---|---|---|---|
| Coolins Gary L | -- | None Available | |
| Collins Gary L | -- | None Available | |
| Collins Gary L | $160,000 | Delta Title & Escrow | |
| Amber Lane Homes Inc | $25,000 | -- |
Source: Public Records
Mortgage History
| Date | Status | Borrower | Loan Amount |
|---|---|---|---|
| Open | Collins Gary L | $140,000 | |
| Previous Owner | Amber Lane Homes Inc | $112,000 |
Source: Public Records
Tax History
| Year | Tax Paid | Tax Assessment Tax Assessment Total Assessment is a certain percentage of the fair market value that is determined by local assessors to be the total taxable value of land and additions on the property. | Land | Improvement |
|---|---|---|---|---|
| 2025 | $2,314 | $20,538 | $1,960 | $18,578 |
| 2024 | $2,101 | $19,911 | $1,959 | $17,952 |
| 2023 | $2,101 | $20,301 | $2,238 | $18,063 |
| 2022 | $2,127 | $18,711 | $2,578 | $16,133 |
| 2021 | $2,041 | $18,136 | $3,200 | $14,936 |
| 2020 | $1,975 | $17,579 | $3,102 | $14,477 |
| 2019 | $1,966 | $17,579 | $3,102 | $14,477 |
| 2018 | $1,905 | $17,579 | $3,102 | $14,477 |
| 2017 | $1,913 | $18,579 | $3,278 | $15,301 |
| 2016 | $1,915 | $18,579 | $3,278 | $15,301 |
| 2015 | $1,926 | $18,579 | $3,278 | $15,301 |
| 2014 | $1,942 | $18,579 | $3,278 | $15,301 |
Source: Public Records
Map
Nearby Homes
- 10923 N 86th East Ave
- 8517 E 108th St N
- 8519 E 109th St N
- 8489 E 109th St N
- 8508 E 109th St N
- 8320 E 106th Place N
- 10924 N 81st Ave E
- 10912 N 81st Ave E
- 10616 N 81st Ave E
- 10855 N 84th East Ct
- 10013 E 107th St N
- 10715 N 101st East Ct
- 8387 E 108th Place N
- 10854 N 84th East Ct
- 10859 N 83rd East Ct
- 11023 N 86th East Ct
- 9601 N 89th East Ave
- 8302 E 110th St N
- 8323 E 111th St N
- 8206 E 110th St N
- 10405 N 90th East Ave
- 8942 E 104th Place N
- 10433 N 90th East Ave
- 10410 N 90th East Ave
- 8861 E 104th Place N
- 8920 E 104th Place N
- 10391 N 90th East Ave
- 8921 E 104th St N
- 10445 N 90th East Ave
- 8849 E 104th Place N
- 8928 E 105th St N
- 10203 N 90th Ave E
- 8916 E 105th St N
- 8924 E 104th St N
- 8909 E 104th St N
- 10507 N 90th Ave E
- 10507 N 90th East Ave
- 8925 E 105th St N
- 8904 E 105th St N
- 8912 E 104th St N
Your Personal Tour Guide
Ask me questions while you tour the home.