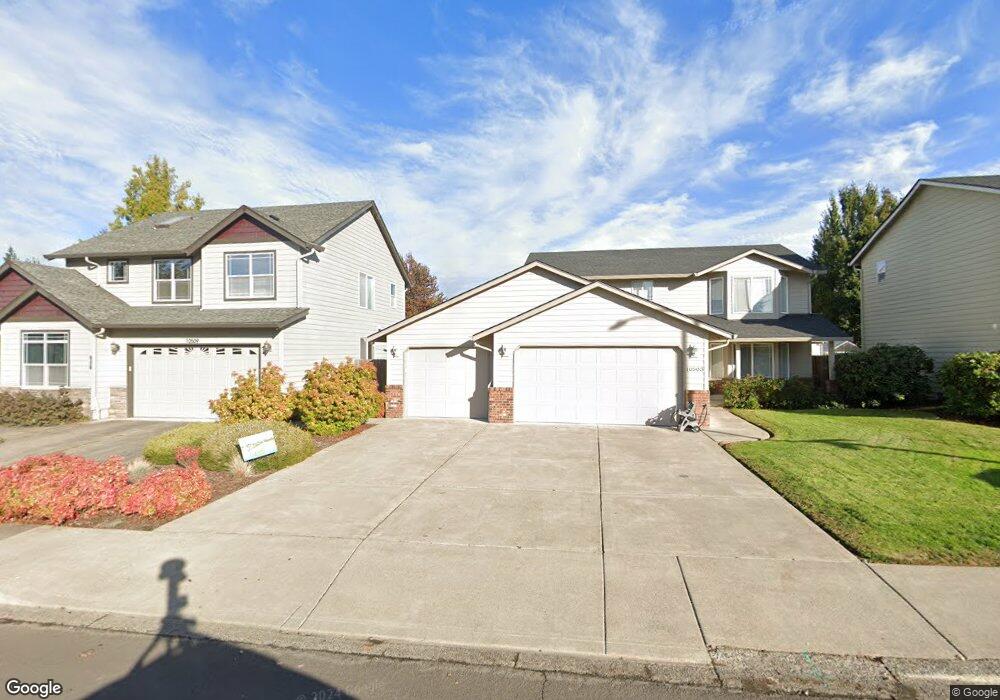
10419 NW 3rd Place Vancouver, WA 98685
Estimated Value: $522,000 - $543,462
3
Beds
2
Baths
1,541
Sq Ft
$347/Sq Ft
Est. Value
About This Home
This home is located at 10419 NW 3rd Place, Vancouver, WA 98685 and is currently estimated at $535,116, approximately $347 per square foot. 10419 NW 3rd Place is a home located in Clark County with nearby schools including Sacajawea Elementary School, Jefferson Middle School, and Columbia River High School.
Ownership History
Date
Name
Owned For
Owner Type
Purchase Details
Closed on
Dec 14, 2009
Sold by
Fannie Mae
Bought by
Bolterman Eileen and Taylor Jeffry S
Current Estimated Value
Home Financials for this Owner
Home Financials are based on the most recent Mortgage that was taken out on this home.
Original Mortgage
$201,286
Outstanding Balance
$131,358
Interest Rate
4.91%
Mortgage Type
FHA
Estimated Equity
$403,758
Purchase Details
Closed on
Sep 14, 2009
Sold by
Bush Mark A and Bush Michelle M
Bought by
Federal National Mortgage Association
Purchase Details
Closed on
Nov 25, 2003
Sold by
Pyramid Homes Inc
Bought by
Bush Mark A and Bush Michelle M
Home Financials for this Owner
Home Financials are based on the most recent Mortgage that was taken out on this home.
Original Mortgage
$158,400
Interest Rate
6%
Mortgage Type
Purchase Money Mortgage
Purchase Details
Closed on
Nov 12, 2003
Sold by
Groves Waldon M
Bought by
Pyramid Homes Inc
Home Financials for this Owner
Home Financials are based on the most recent Mortgage that was taken out on this home.
Original Mortgage
$158,400
Interest Rate
6%
Mortgage Type
Purchase Money Mortgage
Create a Home Valuation Report for This Property
The Home Valuation Report is an in-depth analysis detailing your home's value as well as a comparison with similar homes in the area
Home Values in the Area
Average Home Value in this Area
Purchase History
| Date | Buyer | Sale Price | Title Company |
|---|---|---|---|
| Bolterman Eileen | -- | Stewart Title | |
| Federal National Mortgage Association | $280,760 | Accommodation | |
| Bush Mark A | -- | Chicago Title Insurance | |
| Pyramid Homes Inc | $60,000 | Chicago Title Insurance |
Source: Public Records
Mortgage History
| Date | Status | Borrower | Loan Amount |
|---|---|---|---|
| Open | Bolterman Eileen | $201,286 | |
| Previous Owner | Bush Mark A | $158,400 | |
| Previous Owner | Pyramid Homes Inc | $58,500 |
Source: Public Records
Tax History Compared to Growth
Tax History
| Year | Tax Paid | Tax Assessment Tax Assessment Total Assessment is a certain percentage of the fair market value that is determined by local assessors to be the total taxable value of land and additions on the property. | Land | Improvement |
|---|---|---|---|---|
| 2025 | $5,114 | $500,056 | $180,000 | $320,056 |
| 2024 | $4,782 | $483,880 | $180,000 | $303,880 |
| 2023 | $4,656 | $489,319 | $168,750 | $320,569 |
| 2022 | $4,582 | $472,544 | $211,500 | $261,044 |
| 2021 | $4,399 | $414,333 | $163,625 | $250,708 |
| 2020 | $3,993 | $373,249 | $148,750 | $224,499 |
| 2019 | $3,701 | $359,872 | $149,625 | $210,247 |
| 2018 | $3,879 | $346,100 | $0 | $0 |
| 2017 | $3,373 | $302,812 | $0 | $0 |
| 2016 | $3,198 | $273,552 | $0 | $0 |
| 2015 | $3,169 | $242,430 | $0 | $0 |
| 2014 | -- | $231,922 | $0 | $0 |
| 2013 | -- | $201,992 | $0 | $0 |
Source: Public Records
Map
Nearby Homes
- 322 NW 103rd St
- 10601 NW 7th Ave
- 314 NW 102nd St
- 10707 NW 7th Ave
- 208 NE 106th St
- 905 NW 105th Cir
- 405 NE 105th St
- 420 NE 103rd St
- 421 NE 105th St Unit 421
- 102 NW 99th St
- 11302 NW 7th Ave
- 10214 NW 11th Ave
- 11009 NW 11th Place
- 1100 NW 111th Cir
- 415 NE 99th St
- 118 NW 95th Cir
- 11001 NW 12th Ave
- 11620 NW 2nd Ct
- 415 NW 117th St
- 405 NE 115th Cir
- 10420 NW 3rd Place
- 10417 NW 3rd Place
- 313 NW 106th St
- 10509 NW 4th Ave
- 315 NW 106th St
- 10503 NW 4th Ave
- 311 NW 106th St
- 10421 NW 4th Ave
- 317 NW 106th St
- 10413 NW 3rd Place
- 312 NW 104th St
- 310 NW 104th St
- 309 NW 106th St
- 316 NW 104th St
- 308 NW 104th St
- 17 NW 104th St
- 320 NW 104th St
- 316 NW 106th St
- 10508 NW 4th Ave