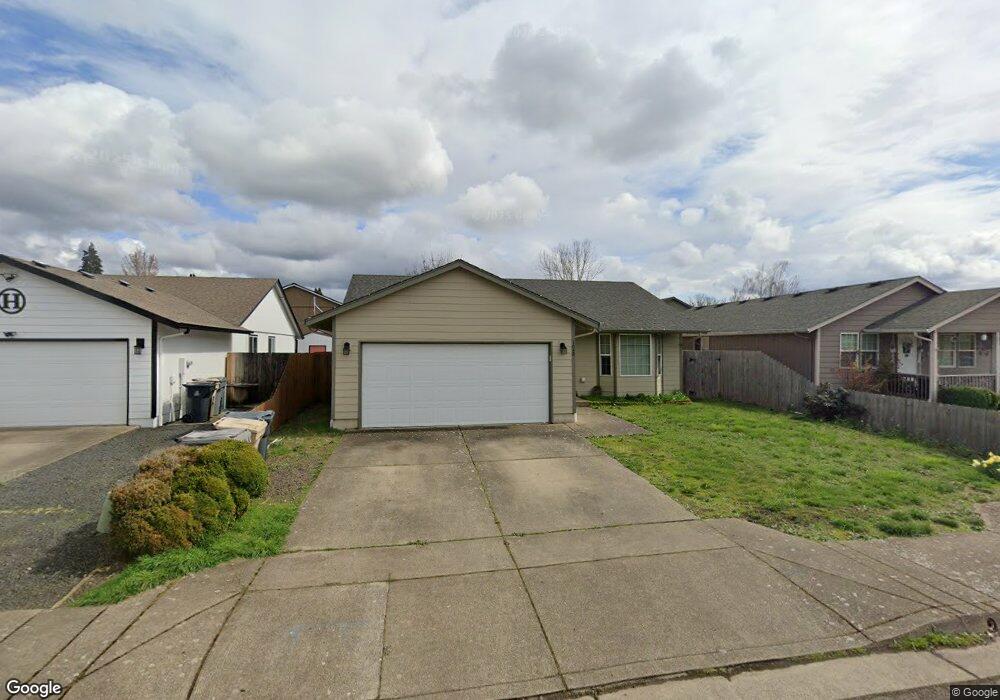
1042 B Loop Lebanon, OR 97355
Estimated Value: $352,000
3
Beds
2
Baths
1,082
Sq Ft
$325/Sq Ft
Est. Value
About This Home
This home is located at 1042 B Loop, Lebanon, OR 97355 and is currently estimated at $352,000, approximately $325 per square foot. 1042 B Loop is a home located in Linn County with nearby schools including Green Acres School, Seven Oak Middle School, and Lebanon High School.
Ownership History
Date
Name
Owned For
Owner Type
Purchase Details
Closed on
Aug 21, 2006
Sold by
Nofziger Travis
Bought by
Walls Mark J
Current Estimated Value
Home Financials for this Owner
Home Financials are based on the most recent Mortgage that was taken out on this home.
Original Mortgage
$11,000
Interest Rate
6.33%
Mortgage Type
Stand Alone Second
Purchase Details
Closed on
Feb 25, 2005
Sold by
Miller Justin A and Miller Samantha C
Bought by
Nofziger Travis
Home Financials for this Owner
Home Financials are based on the most recent Mortgage that was taken out on this home.
Original Mortgage
$99,200
Interest Rate
6.25%
Mortgage Type
Purchase Money Mortgage
Purchase Details
Closed on
Mar 24, 2004
Sold by
Miller Justin A
Bought by
Miller Justin A and Miller Samantha C
Home Financials for this Owner
Home Financials are based on the most recent Mortgage that was taken out on this home.
Original Mortgage
$90,000
Interest Rate
5.64%
Mortgage Type
New Conventional
Create a Home Valuation Report for This Property
The Home Valuation Report is an in-depth analysis detailing your home's value as well as a comparison with similar homes in the area
Home Values in the Area
Average Home Value in this Area
Purchase History
| Date | Buyer | Sale Price | Title Company |
|---|---|---|---|
| Walls Mark J | $140,000 | Lawyers Title Insurance Corp | |
| Nofziger Travis | $122,750 | First American Title | |
| Miller Justin A | -- | Lawyers Title Ins |
Source: Public Records
Mortgage History
| Date | Status | Borrower | Loan Amount |
|---|---|---|---|
| Closed | Walls Mark J | $11,000 | |
| Open | Walls Mark J | $112,000 | |
| Previous Owner | Nofziger Travis | $99,200 | |
| Previous Owner | Miller Justin A | $90,000 | |
| Closed | Miller Justin A | $22,500 | |
| Closed | Nofziger Travis | $24,800 |
Source: Public Records
Tax History
| Year | Tax Paid | Tax Assessment Tax Assessment Total Assessment is a certain percentage of the fair market value that is determined by local assessors to be the total taxable value of land and additions on the property. | Land | Improvement |
|---|---|---|---|---|
| 2025 | $3,618 | $169,390 | -- | -- |
| 2024 | $3,494 | $164,460 | -- | -- |
| 2023 | $3,382 | $159,670 | $0 | $0 |
| 2022 | $3,316 | $155,020 | $0 | $0 |
| 2021 | $3,202 | $150,510 | $0 | $0 |
| 2020 | $3,167 | $146,130 | $0 | $0 |
| 2019 | $3,012 | $141,880 | $0 | $0 |
| 2018 | $2,985 | $137,750 | $0 | $0 |
| 2017 | $2,823 | $133,740 | $0 | $0 |
| 2016 | $2,570 | $129,850 | $0 | $0 |
Source: Public Records
Map
Nearby Homes
Your Personal Tour Guide
Ask me questions while you tour the home.