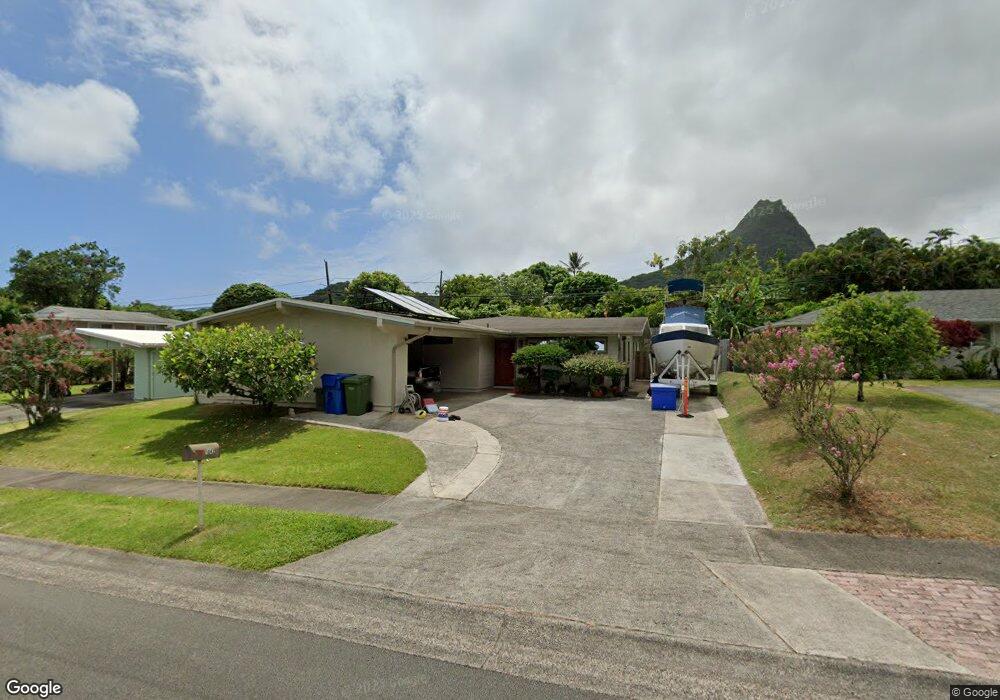
1042 Maunawili Rd Kailua, HI 96734
Estimated Value: $1,393,740 - $1,559,000
3
Beds
2
Baths
1,812
Sq Ft
$798/Sq Ft
Est. Value
About This Home
This home is located at 1042 Maunawili Rd, Kailua, HI 96734 and is currently estimated at $1,446,435, approximately $798 per square foot. 1042 Maunawili Rd is a home located in Honolulu County with nearby schools including Maunawili Elementary School, Kailua Intermediate School, and Kailua High School.
Ownership History
Date
Name
Owned For
Owner Type
Purchase Details
Closed on
Dec 22, 2023
Sold by
Kaneko Dale Keiko and Norman Motoki
Bought by
Sonoda Nick Masayoshi and Sonoda Shara Alisa
Current Estimated Value
Home Financials for this Owner
Home Financials are based on the most recent Mortgage that was taken out on this home.
Original Mortgage
$190,000
Outstanding Balance
$186,810
Interest Rate
7.44%
Mortgage Type
New Conventional
Estimated Equity
$1,259,625
Purchase Details
Closed on
Oct 31, 2023
Sold by
Revocable Trust
Bought by
Sonoda Nick Masayoshi and Alisa Leinan Sonoda Shara
Home Financials for this Owner
Home Financials are based on the most recent Mortgage that was taken out on this home.
Original Mortgage
$190,000
Outstanding Balance
$186,810
Interest Rate
7.44%
Mortgage Type
New Conventional
Estimated Equity
$1,259,625
Create a Home Valuation Report for This Property
The Home Valuation Report is an in-depth analysis detailing your home's value as well as a comparison with similar homes in the area
Home Values in the Area
Average Home Value in this Area
Purchase History
| Date | Buyer | Sale Price | Title Company |
|---|---|---|---|
| Sonoda Nick Masayoshi | -- | Tge | |
| Sonoda Nick Masayoshi | -- | None Listed On Document | |
| Kaneko Dale Keiko | -- | None Listed On Document |
Source: Public Records
Mortgage History
| Date | Status | Borrower | Loan Amount |
|---|---|---|---|
| Open | Sonoda Nick Masayoshi | $190,000 |
Source: Public Records
Tax History Compared to Growth
Tax History
| Year | Tax Paid | Tax Assessment Tax Assessment Total Assessment is a certain percentage of the fair market value that is determined by local assessors to be the total taxable value of land and additions on the property. | Land | Improvement |
|---|---|---|---|---|
| 2025 | $8,571 | $1,326,500 | $1,197,900 | $128,600 |
| 2024 | $8,571 | $1,401,000 | $1,235,400 | $165,600 |
| 2023 | $8,351 | $1,381,700 | $1,123,000 | $258,700 |
| 2022 | $6,914 | $1,229,900 | $973,300 | $256,600 |
| 2021 | $5,955 | $1,138,600 | $816,100 | $322,500 |
| 2020 | $3,301 | $943,100 | $801,100 | $142,000 |
| 2019 | $3,340 | $954,300 | $801,100 | $153,200 |
| 2018 | $3,448 | $985,000 | $801,100 | $183,900 |
| 2017 | $3,293 | $940,900 | $740,500 | $200,400 |
| 2016 | $3,219 | $919,600 | $681,200 | $238,400 |
| 2015 | $3,041 | $868,800 | $666,400 | $202,400 |
| 2014 | $2,534 | $833,100 | $622,000 | $211,100 |
Source: Public Records
Map
Nearby Homes
- 1126 Lunaai St
- 1193 Kika Place
- 1230 Lola Place
- 1234 Kelewina Place
- 1362 Lopaka Place
- 0 Lopaka Way Unit 1 202518123
- 1379A Manu Aloha St Unit B
- 637 Manu Oo St Unit A
- 1109 Akipohe St Unit 14C
- 42-103 Old Kalanianaole Rd
- 1187C Akipohe St Unit 8C
- 42-311 Old Kalanianaole Rd
- 1318 Akele St
- 1433 Akanahe Place
- 322 Keolu Dr
- 133 Kahako St Unit A
- 42-100 Old Kalanianaole Rd Unit 8
- 1384 Nanawale Place
- 1410 Kahili St Unit A
- 599 Keolu Dr Unit B
- 1046 Maunawili Rd
- 1040 Maunawili Rd
- 1040 Maunawili Loop
- 1036 Maunawili Rd
- 1050 Maunawili Rd
- 1043 Maunawili Rd
- 1047 Maunawili Rd
- 1039 Maunawili Rd
- 1032 Maunawili Rd
- 1049 Maunawili Rd
- 1054 Maunawili Rd
- 1035 Maunawili Rd
- 1036 Maunawili Loop
- 1056 Maunawili Loop
- 1052 Maunawili Loop
- 1028 Maunawili Rd
- 1031 Maunawili Rd
- 1055 Lunahooia Place
- 1056 Lunahooia Place
- 1066 Maunawili Rd