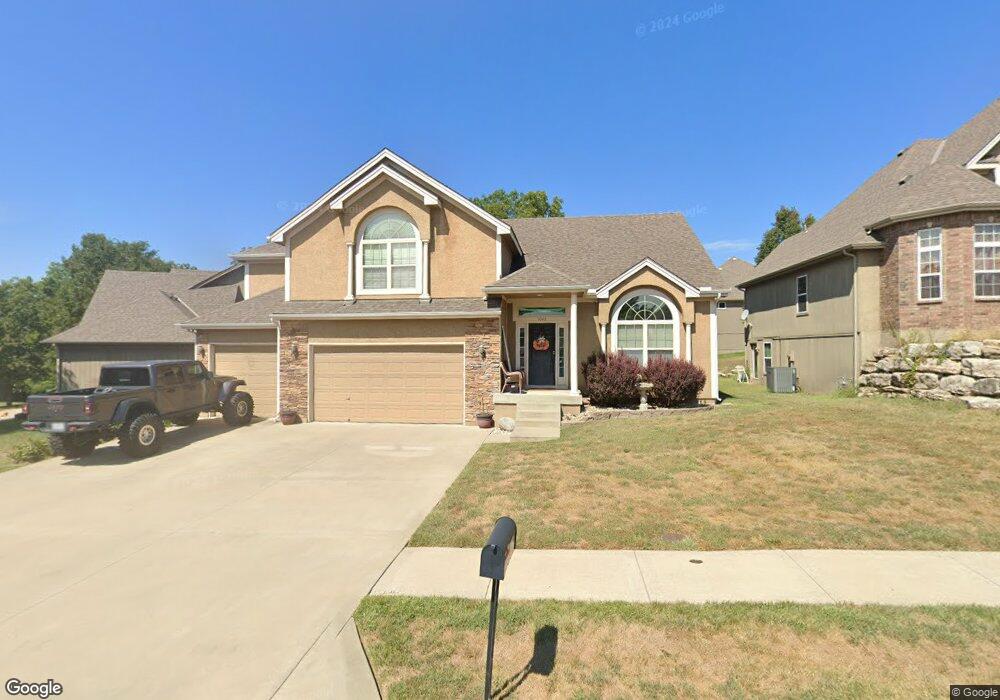
1042 N Hanover Ct Independence, MO 64056
Ripley NeighborhoodEstimated Value: $366,000 - $482,000
4
Beds
3
Baths
1,974
Sq Ft
$210/Sq Ft
Est. Value
About This Home
This home is located at 1042 N Hanover Ct, Independence, MO 64056 and is currently estimated at $414,345, approximately $209 per square foot. 1042 N Hanover Ct is a home located in Jackson County with nearby schools including Fort Osage High School.
Ownership History
Date
Name
Owned For
Owner Type
Purchase Details
Closed on
Jun 5, 2018
Sold by
Keys Coleman O
Bought by
Laster Roy G and Laster Christy L
Current Estimated Value
Home Financials for this Owner
Home Financials are based on the most recent Mortgage that was taken out on this home.
Original Mortgage
$220,000
Outstanding Balance
$190,263
Interest Rate
4.5%
Mortgage Type
Purchase Money Mortgage
Estimated Equity
$224,082
Purchase Details
Closed on
Dec 15, 2009
Sold by
Saysoff Vickie L
Bought by
Keys Coleman O
Purchase Details
Closed on
Oct 13, 2009
Sold by
Harter Bobbie Jo
Bought by
Saysoff Vickie L and Keys Coleman O
Purchase Details
Closed on
Jun 15, 2009
Sold by
Mcbee Custom Homes Llc
Bought by
Harter Bobbie Jo
Purchase Details
Closed on
Aug 5, 2005
Sold by
Andachter Pollard Development Llc
Bought by
Mcbee Niemeyer Companies Llc
Home Financials for this Owner
Home Financials are based on the most recent Mortgage that was taken out on this home.
Original Mortgage
$195,500
Interest Rate
5.78%
Mortgage Type
Construction
Create a Home Valuation Report for This Property
The Home Valuation Report is an in-depth analysis detailing your home's value as well as a comparison with similar homes in the area
Home Values in the Area
Average Home Value in this Area
Purchase History
| Date | Buyer | Sale Price | Title Company |
|---|---|---|---|
| Laster Roy G | -- | Stewart Title | |
| Keys Coleman O | -- | None Available | |
| Saysoff Vickie L | -- | None Available | |
| Harter Bobbie Jo | -- | Kansas City Title | |
| Mcbee Niemeyer Companies Llc | -- | First American Title |
Source: Public Records
Mortgage History
| Date | Status | Borrower | Loan Amount |
|---|---|---|---|
| Open | Laster Roy G | $220,000 | |
| Previous Owner | Mcbee Niemeyer Companies Llc | $195,500 |
Source: Public Records
Tax History Compared to Growth
Tax History
| Year | Tax Paid | Tax Assessment Tax Assessment Total Assessment is a certain percentage of the fair market value that is determined by local assessors to be the total taxable value of land and additions on the property. | Land | Improvement |
|---|---|---|---|---|
| 2025 | $5,901 | $81,664 | $6,053 | $75,611 |
| 2024 | $5,901 | $74,309 | $6,346 | $67,963 |
| 2023 | $5,873 | $74,309 | $6,346 | $67,963 |
| 2022 | $5,137 | $61,750 | $6,014 | $55,736 |
| 2021 | $5,135 | $61,750 | $6,014 | $55,736 |
| 2020 | $4,955 | $58,775 | $6,014 | $52,761 |
| 2019 | $4,907 | $58,775 | $6,014 | $52,761 |
| 2018 | $1,724,904 | $49,949 | $6,331 | $43,618 |
| 2017 | $3,748 | $49,949 | $6,331 | $43,618 |
| 2016 | $3,748 | $48,697 | $7,030 | $41,667 |
| 2014 | $3,455 | $44,650 | $7,030 | $37,620 |
Source: Public Records
Map
Nearby Homes
- 1208 N Holland Dr
- 1305 N Holland Dr
- 1329 N Holland Dr
- 1308 N Holland Dr
- 1349 N Holland Dr
- 20500 E Bundschu Rd
- 717 N Cloverdale Ave
- 709 N Belvidere Ave
- 731 N Glenview Ct
- 19707 E 14th St N
- 1105 N Powell Rd
- 1401 N Powell Rd
- 19706 E 14th St N
- 20213 E 14th Terrace Ct N
- 0 Tbd Rd Unit HMS2511302
- 19707 E 6th Terrace N
- 19704 E 14th Terrace N
- 301 & 401 N Jones Rd
- 19708 E 6th St N
- 842 N Aztec Dr
- 1038 N Hanover Ct
- 1043 N Hanover Ct
- 1039 N Hanover Ct
- 1046 N Hanover Ct
- 1034 N Hanover Ct
- 1047 N Hanover Ct
- 1035 N Hanover Ct
- 1120 N Old Mill Rd
- 1030 N Hanover Ct
- 1031 N Hanover Ct
- 1124 N Old Mill Rd
- 1101 N Hanover Ave
- 1115 N Old Mill Rd
- 1121 N Old Mill Rd
- 1125 N Old Mill Rd
- 1105 N Hanover Ave
- 1201 N Old Mill Rd
- 1110 N Holland Dr
- 1200 N Old Mill Rd
- 1114 N Holland Dr