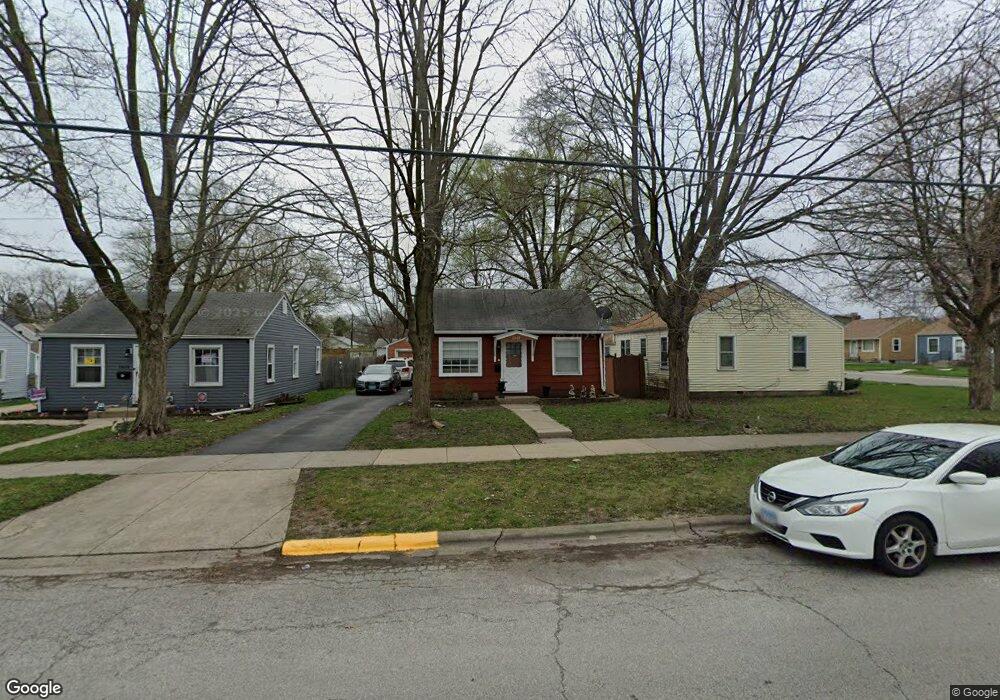
1042 Plum St Aurora, IL 60506
Blackhawk NeighborhoodEstimated Value: $219,000 - $251,000
2
Beds
1
Bath
840
Sq Ft
$287/Sq Ft
Est. Value
About This Home
This home is located at 1042 Plum St, Aurora, IL 60506 and is currently estimated at $240,729, approximately $286 per square foot. 1042 Plum St is a home located in Kane County with nearby schools including Mccleery Elementary School, Jefferson Middle School, and West Aurora High School.
Ownership History
Date
Name
Owned For
Owner Type
Purchase Details
Closed on
Jul 31, 2002
Sold by
Medina Humberto
Bought by
Gonzalez Alfredo and Mejia Marta
Current Estimated Value
Home Financials for this Owner
Home Financials are based on the most recent Mortgage that was taken out on this home.
Original Mortgage
$104,362
Outstanding Balance
$44,192
Interest Rate
6.56%
Mortgage Type
FHA
Estimated Equity
$196,537
Purchase Details
Closed on
Jan 20, 1998
Sold by
Mann Michael J and Mann Andrea M
Bought by
Medina Humberto
Home Financials for this Owner
Home Financials are based on the most recent Mortgage that was taken out on this home.
Original Mortgage
$77,126
Interest Rate
7.16%
Mortgage Type
FHA
Purchase Details
Closed on
Aug 19, 1994
Sold by
Harkless Kevin R
Bought by
Mann Michael J and Mann Andrea M
Home Financials for this Owner
Home Financials are based on the most recent Mortgage that was taken out on this home.
Original Mortgage
$70,700
Interest Rate
8.59%
Mortgage Type
FHA
Create a Home Valuation Report for This Property
The Home Valuation Report is an in-depth analysis detailing your home's value as well as a comparison with similar homes in the area
Home Values in the Area
Average Home Value in this Area
Purchase History
| Date | Buyer | Sale Price | Title Company |
|---|---|---|---|
| Gonzalez Alfredo | $106,000 | Multiple | |
| Medina Humberto | $78,500 | Law Title Insurance Co Inc | |
| Mann Michael J | $47,333 | Law Title Insurance Co Inc |
Source: Public Records
Mortgage History
| Date | Status | Borrower | Loan Amount |
|---|---|---|---|
| Open | Gonzalez Alfredo | $104,362 | |
| Previous Owner | Medina Humberto | $77,126 | |
| Previous Owner | Mann Michael J | $70,700 |
Source: Public Records
Tax History Compared to Growth
Tax History
| Year | Tax Paid | Tax Assessment Tax Assessment Total Assessment is a certain percentage of the fair market value that is determined by local assessors to be the total taxable value of land and additions on the property. | Land | Improvement |
|---|---|---|---|---|
| 2024 | $4,964 | $62,691 | $6,526 | $56,165 |
| 2023 | $4,798 | $56,014 | $5,831 | $50,183 |
| 2022 | $4,524 | $51,107 | $5,320 | $45,787 |
| 2021 | $4,347 | $47,581 | $4,953 | $42,628 |
| 2020 | $4,137 | $44,196 | $4,601 | $39,595 |
| 2019 | $4,004 | $40,949 | $4,263 | $36,686 |
| 2018 | $3,545 | $35,511 | $3,943 | $31,568 |
| 2017 | $3,367 | $32,718 | $3,633 | $29,085 |
| 2016 | $3,069 | $28,885 | $3,114 | $25,771 |
| 2015 | -- | $24,638 | $2,678 | $21,960 |
| 2014 | -- | $23,581 | $2,461 | $21,120 |
| 2013 | -- | $24,684 | $2,476 | $22,208 |
Source: Public Records
Map
Nearby Homes
- 943 Charles St
- 900 Charles St
- 930 W New York St Unit 932
- 616 Morton Ave
- 809 W Park Ave
- 931 W Downer Place
- 1104 New Haven Ave
- 850 W Galena Blvd
- 781 N Elmwood Dr
- 795 N Elmwood Dr
- 1351 Monomoy St Unit D
- 710 W Downer Place
- 231 W Downer Place
- 175 S Harrison Ave
- 149 S Gladstone Ave
- 1389 Monomoy St Unit B2
- 833 N Randall Rd Unit C4
- 164 S Calumet Ave
- 237 Ingleside Ave
- 541 Charles St
- 1038 Plum St
- 415 N Fordham Ave
- 407 N Fordham Ave
- 1034 Plum St
- 405 N Fordham Ave
- 1030 Plum St
- 406 Sheldon Ave
- 501 N Fordham Ave
- 1039 Plum St
- 404 Sheldon Ave
- 414 Sheldon Ave
- 414 N Fordham Ave
- 410 N Fordham Ave
- 400 Sheldon Ave
- 416 N Fordham Ave
- 1035 Plum St
- 406 N Fordham Ave
- 505 N Fordham Ave
- 1031 Plum St
- 404 N Fordham Ave