1042 Point View Rd Chapin, SC 29036
Estimated Value: $458,000 - $1,134,000
4
Beds
7
Baths
2,196
Sq Ft
$397/Sq Ft
Est. Value
About This Home
This home is located at 1042 Point View Rd, Chapin, SC 29036 and is currently estimated at $871,707, approximately $396 per square foot. 1042 Point View Rd is a home with nearby schools including Lake Murray Elementary School, Chapin Intermediate, and Chapin High School.
Ownership History
Date
Name
Owned For
Owner Type
Purchase Details
Closed on
Oct 30, 2020
Sold by
Derrick Jr George M
Bought by
Derrick George M and Derrick Connie D
Current Estimated Value
Purchase Details
Closed on
Dec 16, 2019
Sold by
Darrell Roland Charles
Bought by
Neal David Bryan and Neal Gay Turner
Home Financials for this Owner
Home Financials are based on the most recent Mortgage that was taken out on this home.
Original Mortgage
$417,000
Interest Rate
3.73%
Purchase Details
Closed on
Oct 26, 2012
Sold by
Derrick George M
Bought by
Derrick Connie D
Home Financials for this Owner
Home Financials are based on the most recent Mortgage that was taken out on this home.
Original Mortgage
$417,000
Interest Rate
3.42%
Mortgage Type
Future Advance Clause Open End Mortgage
Purchase Details
Closed on
Aug 15, 2005
Sold by
Derrick George M and Derrick Cindy C
Bought by
Derrick George M and Derrick Cindy C
Purchase Details
Closed on
Sep 20, 1999
Sold by
Csele Michael J
Bought by
Derrick George M
Purchase Details
Closed on
May 6, 1998
Sold by
Hudson Dorothy E
Bought by
Csele Michael J
Create a Home Valuation Report for This Property
The Home Valuation Report is an in-depth analysis detailing your home's value as well as a comparison with similar homes in the area
Home Values in the Area
Average Home Value in this Area
Purchase History
| Date | Buyer | Sale Price | Title Company |
|---|---|---|---|
| Derrick George M | -- | None Listed On Document | |
| Neal David Bryan | $320,000 | None Listed On Document | |
| Derrick Connie D | -- | -- | |
| Derrick George M | -- | -- | |
| Derrick George M | $107,500 | -- | |
| Csele Michael J | $86,000 | -- |
Source: Public Records
Mortgage History
| Date | Status | Borrower | Loan Amount |
|---|---|---|---|
| Previous Owner | Neal David Bryan | $417,000 | |
| Previous Owner | Derrick Connie D | $417,000 |
Source: Public Records
Tax History
| Year | Tax Paid | Tax Assessment Tax Assessment Total Assessment is a certain percentage of the fair market value that is determined by local assessors to be the total taxable value of land and additions on the property. | Land | Improvement |
|---|---|---|---|---|
| 2024 | $4,136 | $27,349 | $11,811 | $15,538 |
| 2023 | $3,793 | $27,349 | $11,811 | $15,538 |
| 2022 | $3,841 | $27,349 | $11,811 | $15,538 |
| 2020 | $4,027 | $27,349 | $11,811 | $15,538 |
| 2019 | $3,511 | $23,781 | $7,926 | $15,855 |
| 2018 | $3,084 | $23,781 | $7,926 | $15,855 |
| 2017 | $3,001 | $23,781 | $7,926 | $15,855 |
| 2016 | $3,438 | $23,780 | $7,926 | $15,854 |
| 2014 | $4,060 | $10,413 | $10,352 | $61 |
| 2013 | -- | $10,410 | $10,350 | $60 |
Source: Public Records
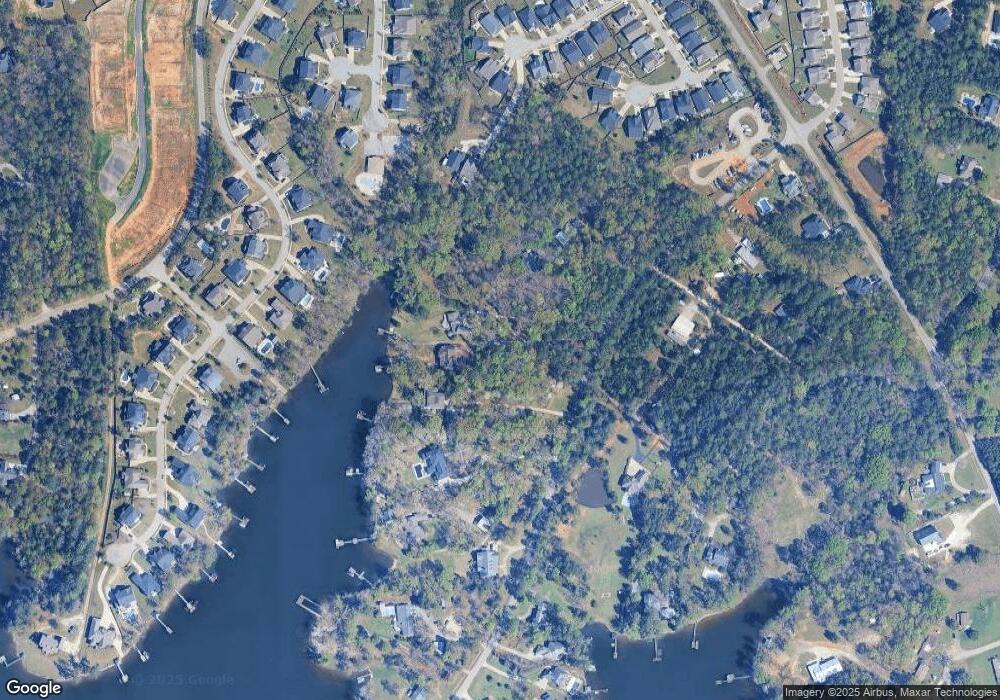
Map
Nearby Homes
- 1081 Point View Rd
- 533 Mitscher Way
- 417 Brookridge Dr
- 516 Mitscher Way
- 454 Brookridge Dr
- 1420 Saugus Ct
- 603 Riverdale Ct
- 2019 Ludlow Place
- 2051 Ludlow Place
- 2130 Ludlow Place
- 2708 Pawtucket Way
- 306 Rising Stream Way
- 314 Rising Stream Way
- 302 Rising Stream Way
- 2610 Pawtucket Way
- 414 Rising Stream Way
- 337 Rising Stream Way
- 343 Rising Stream Way
- 734 Autumn Shiloh Dr
- 419 Rising Stream Way
- 1038 Point View Rd
- 1046 Point View Rd
- 1054 Point View Rd
- 1056 Point View Rd
- 1056 Point View Rd
- 1058 Point View Rd
- 266 Brookridge Dr
- 262 Brookridge Dr
- 258 Brookridge Dr
- 270 Brookridge Dr
- 1064 Point View Rd
- 254 Brookridge Dr
- 841 Summer Sands Ct
- 1051 Point View Rd
- 1037 Point View Rd
- 837 Summer Sands Ct
- 274 Brookridge Dr
- 0 Brookridge Dr Unit 215006
- 0 Brookridge Dr Unit 215005
- 0 Brookridge Ln Unit 215001
Your Personal Tour Guide
Ask me questions while you tour the home.