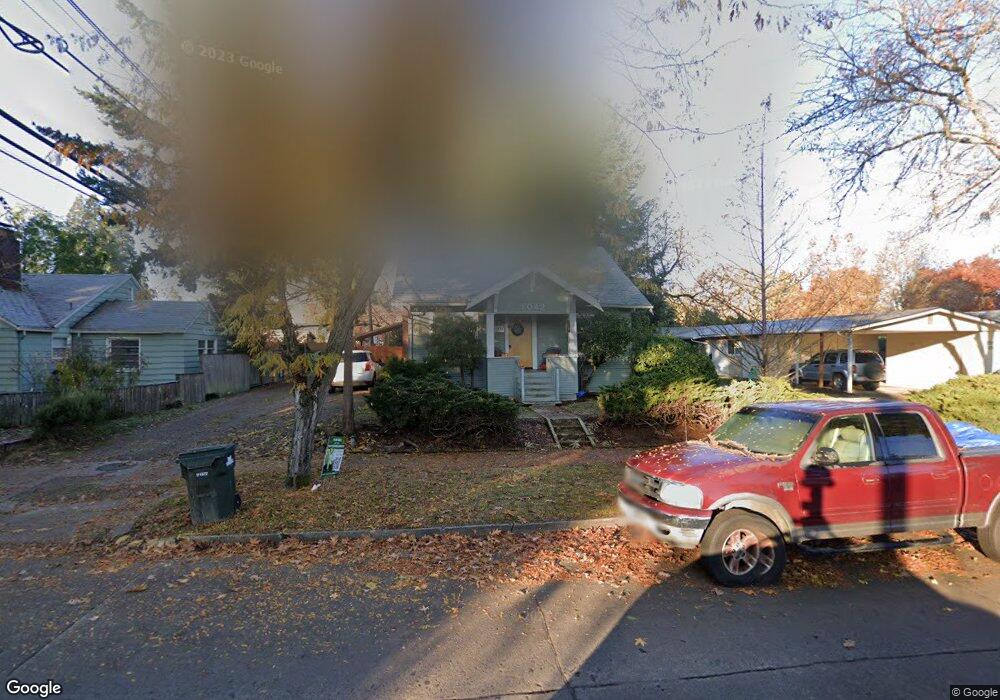
1042 Polk St Eugene, OR 97402
Jefferson Westside NeighborhoodEstimated Value: $425,000 - $657,000
4
Beds
2
Baths
2,580
Sq Ft
$212/Sq Ft
Est. Value
About This Home
This home is located at 1042 Polk St, Eugene, OR 97402 and is currently estimated at $547,357, approximately $212 per square foot. 1042 Polk St is a home located in Lane County with nearby schools including Cesar Chavez Elementary School, Arts And Technology Academy At Jefferson, and Churchill High School.
Ownership History
Date
Name
Owned For
Owner Type
Purchase Details
Closed on
Apr 11, 2024
Sold by
Tapper Clinton L and Tapper Karen S
Bought by
Clinton L Tapper And Karen S Tapper Trust and Tapper
Current Estimated Value
Purchase Details
Closed on
Sep 6, 2017
Sold by
Tapper Clinton and Tapper Karen
Bought by
Tapper Karen
Purchase Details
Closed on
Nov 23, 2015
Sold by
Crecine Robert P
Bought by
Tapper Clinton L and Tapper Karen M
Home Financials for this Owner
Home Financials are based on the most recent Mortgage that was taken out on this home.
Original Mortgage
$273,600
Interest Rate
3.76%
Mortgage Type
New Conventional
Purchase Details
Closed on
May 18, 2015
Sold by
Crecine Robert P
Bought by
Crecine Robert P
Purchase Details
Closed on
Jul 14, 2009
Sold by
Prickel Maxine Frauman and Prickel Donald Omer
Bought by
Prickel Donald Omer and Prickel Maxine Frauman
Create a Home Valuation Report for This Property
The Home Valuation Report is an in-depth analysis detailing your home's value as well as a comparison with similar homes in the area
Home Values in the Area
Average Home Value in this Area
Purchase History
| Date | Buyer | Sale Price | Title Company |
|---|---|---|---|
| Clinton L Tapper And Karen S Tapper Trust | -- | None Listed On Document | |
| Tapper Clinton L | -- | None Listed On Document | |
| Tapper Karen | -- | None Available | |
| Tapper Clinton L | $288,000 | Fidelity Natl Title Co Of Or | |
| Crecine Robert P | -- | None Available | |
| Prickel Donald Omer | -- | None Available |
Source: Public Records
Mortgage History
| Date | Status | Borrower | Loan Amount |
|---|---|---|---|
| Previous Owner | Tapper Clinton L | $273,600 |
Source: Public Records
Tax History
| Year | Tax Paid | Tax Assessment Tax Assessment Total Assessment is a certain percentage of the fair market value that is determined by local assessors to be the total taxable value of land and additions on the property. | Land | Improvement |
|---|---|---|---|---|
| 2025 | $4,086 | $209,721 | -- | -- |
| 2024 | $4,035 | $203,613 | -- | -- |
| 2023 | $4,035 | $197,683 | $0 | $0 |
| 2022 | $3,780 | $191,926 | $0 | $0 |
| 2021 | $3,551 | $186,336 | $0 | $0 |
| 2020 | $3,563 | $180,909 | $0 | $0 |
| 2019 | $3,441 | $175,640 | $0 | $0 |
| 2018 | $3,239 | $165,558 | $0 | $0 |
| 2017 | $3,094 | $165,558 | $0 | $0 |
| 2016 | $3,017 | $160,736 | $0 | $0 |
| 2015 | $2,931 | $156,054 | $0 | $0 |
| 2014 | -- | $151,509 | $0 | $0 |
Source: Public Records
Map
Nearby Homes
- 1362 W 11th Ave
- 1130 Polk St
- 1445 W 11th Ave
- 1255 Taylor St
- 1230 W 7th Ave
- 780 Van Buren St
- 0 W 7th Aly
- 710 Van Buren St
- 996 W 8th Ave
- 1612 Polk St
- 1243 Hayes St
- 990 W 7th Ave
- 960 W 7th Ave
- 1875 W 15th Ave
- 710 W 11th Ave
- 1391 W 5th Ave
- 0 W 15th Ave Unit Lot B
- 439 Almaden St
- 1030 W 5th Ave
- 5713 Durst St
Your Personal Tour Guide
Ask me questions while you tour the home.