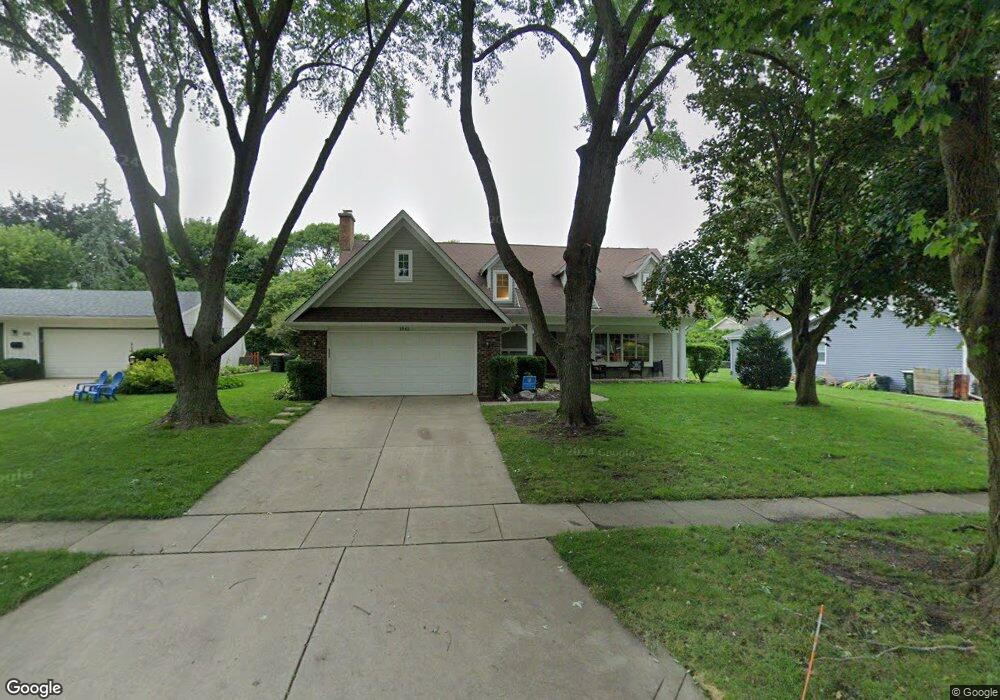
1042 Regency Ln Libertyville, IL 60048
South Libertyville NeighborhoodEstimated Value: $519,000 - $628,000
--
Bed
3
Baths
1,951
Sq Ft
$289/Sq Ft
Est. Value
About This Home
This home is located at 1042 Regency Ln, Libertyville, IL 60048 and is currently estimated at $564,770, approximately $289 per square foot. 1042 Regency Ln is a home located in Lake County with nearby schools including Copeland Manor Elementary School, Highland Middle School, and Libertyville High School.
Ownership History
Date
Name
Owned For
Owner Type
Purchase Details
Closed on
Aug 7, 2024
Sold by
Guiard Christophe M and Guiard Laura G
Bought by
Guiard Family Trust and Guiard
Current Estimated Value
Purchase Details
Closed on
Nov 20, 1999
Sold by
Schmidt Brian W and Schmidt Jennifer G
Bought by
Guiard Christophe M and Guiard Laura G
Home Financials for this Owner
Home Financials are based on the most recent Mortgage that was taken out on this home.
Original Mortgage
$187,000
Interest Rate
7.69%
Purchase Details
Closed on
May 5, 1998
Sold by
Monkemeier Douglas W and Monkemeier Merri E
Bought by
Schmidt Brian W and Schmidt Jennifer G
Home Financials for this Owner
Home Financials are based on the most recent Mortgage that was taken out on this home.
Original Mortgage
$173,600
Interest Rate
7.27%
Create a Home Valuation Report for This Property
The Home Valuation Report is an in-depth analysis detailing your home's value as well as a comparison with similar homes in the area
Home Values in the Area
Average Home Value in this Area
Purchase History
| Date | Buyer | Sale Price | Title Company |
|---|---|---|---|
| Guiard Family Trust | -- | None Listed On Document | |
| Guiard Christophe M | $225,000 | -- | |
| Schmidt Brian W | $217,000 | Chicago Title Insurance Co |
Source: Public Records
Mortgage History
| Date | Status | Borrower | Loan Amount |
|---|---|---|---|
| Previous Owner | Guiard Christophe M | $187,000 | |
| Previous Owner | Schmidt Brian W | $173,600 | |
| Closed | Schmidt Brian W | $21,700 |
Source: Public Records
Tax History Compared to Growth
Tax History
| Year | Tax Paid | Tax Assessment Tax Assessment Total Assessment is a certain percentage of the fair market value that is determined by local assessors to be the total taxable value of land and additions on the property. | Land | Improvement |
|---|---|---|---|---|
| 2024 | $11,689 | $166,043 | $66,439 | $99,604 |
| 2023 | $11,486 | $153,148 | $61,279 | $91,869 |
| 2022 | $11,486 | $149,618 | $58,900 | $90,718 |
| 2021 | $11,057 | $146,397 | $57,632 | $88,765 |
| 2020 | $10,641 | $143,936 | $56,663 | $87,273 |
| 2019 | $10,376 | $142,567 | $56,124 | $86,443 |
| 2018 | $10,090 | $143,382 | $55,896 | $87,486 |
| 2017 | $9,949 | $138,855 | $54,131 | $84,724 |
| 2016 | $9,616 | $143,803 | $51,324 | $92,479 |
| 2015 | $10,449 | $134,408 | $47,971 | $86,437 |
| 2014 | $8,786 | $113,983 | $45,073 | $68,910 |
| 2012 | $6,605 | $112,719 | $44,573 | $68,146 |
Source: Public Records
Map
Nearby Homes
- 2245 Hazeltime Dr
- 1137 Pine Tree Ln
- 533 Drake St
- 1017 Juniper Pkwy
- 20924 & 20902 W Park Ave
- 422 Shadow Creek Dr
- 1330 W Park Ave
- 777 Garfield Ave Unit A
- 747 Garfield Ave Unit C
- 0 Ames St
- 851 Garfield Ave Unit C
- 501 Hemlock Ln
- 323 W Golf Rd
- 423 Ames St
- 223 Kenloch Ave
- 1969 Royal Birkdale Dr
- 551 W Park Ave Unit E
- 164 W Golf Rd Unit A
- 847 Mckinley Ave
- 308 Mckinley Ave
- 1036 Regency Ln
- 1043 Fairlawn Ave
- 1103 Fairlawn Ave
- 1037 Fairlawn Ave
- 1030 Regency Ln Unit 1
- 1106 Regency Ln
- 1049 Regency Ln
- 1101 Regency Ln Unit 1
- 1109 Fairlawn Ave
- 1031 Fairlawn Ave
- 1043 Regency Ln Unit 1
- 1107 Regency Ln
- 1024 Regency Ln
- 1112 Regency Ln
- 1037 Regency Ln Unit 1
- 1115 Fairlawn Ave
- 1025 Fairlawn Ave
- 1113 Regency Ln Unit 1
- 1044 Fairlawn Ave
- 1018 Regency Ln