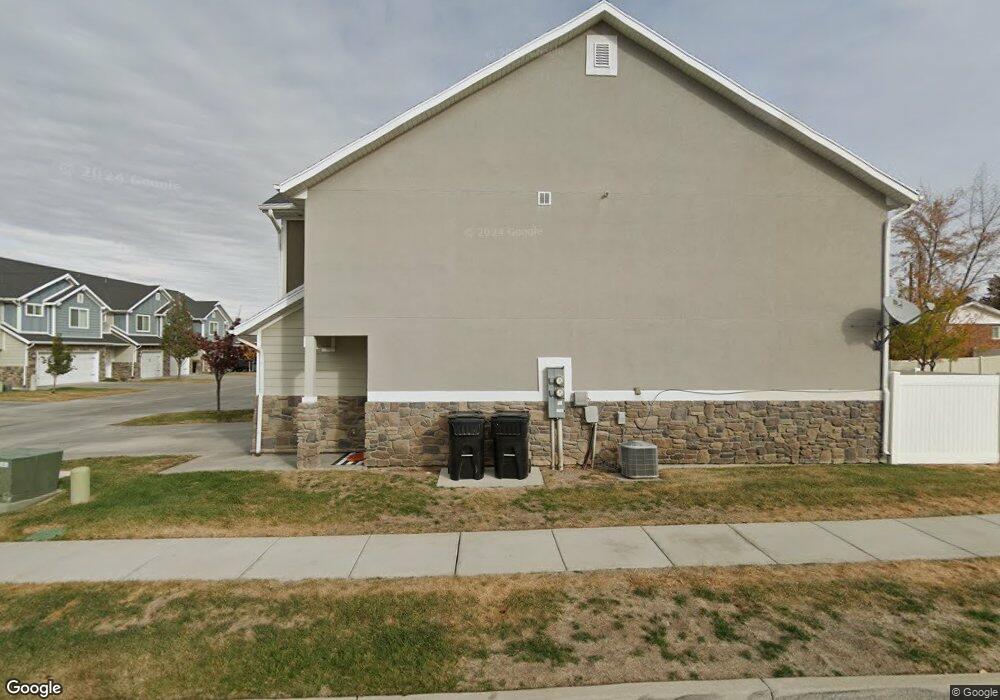
1042 W 2050 S Unit 3 Syracuse, UT 84075
Estimated Value: $385,000 - $411,000
3
Beds
3
Baths
1,392
Sq Ft
$286/Sq Ft
Est. Value
About This Home
This home is located at 1042 W 2050 S Unit 3, Syracuse, UT 84075 and is currently estimated at $398,285, approximately $286 per square foot. 1042 W 2050 S Unit 3 is a home located in Davis County with nearby schools including Bluff Ridge Elementary, Legacy Junior High School, and Clearfield High School.
Ownership History
Date
Name
Owned For
Owner Type
Purchase Details
Closed on
Jan 9, 2020
Sold by
Glover Mike L
Bought by
Glover Mike L and Glover Trystin
Current Estimated Value
Purchase Details
Closed on
Jan 21, 2015
Sold by
Castle Creek Homes Llc
Bought by
Bonney Lindsey J
Home Financials for this Owner
Home Financials are based on the most recent Mortgage that was taken out on this home.
Original Mortgage
$154,666
Outstanding Balance
$118,598
Interest Rate
3.87%
Mortgage Type
New Conventional
Estimated Equity
$279,687
Purchase Details
Closed on
Feb 28, 2014
Sold by
Castle Creek Homes Llc
Bought by
Glover Mike L
Home Financials for this Owner
Home Financials are based on the most recent Mortgage that was taken out on this home.
Original Mortgage
$107,597
Interest Rate
4.38%
Mortgage Type
New Conventional
Create a Home Valuation Report for This Property
The Home Valuation Report is an in-depth analysis detailing your home's value as well as a comparison with similar homes in the area
Home Values in the Area
Average Home Value in this Area
Purchase History
| Date | Buyer | Sale Price | Title Company |
|---|---|---|---|
| Glover Mike L | -- | None Available | |
| Bonney Lindsey J | -- | Mountain View Title & | |
| Glover Mike L | -- | Mountain View Title & |
Source: Public Records
Mortgage History
| Date | Status | Borrower | Loan Amount |
|---|---|---|---|
| Open | Bonney Lindsey J | $154,666 | |
| Previous Owner | Glover Mike L | $107,597 |
Source: Public Records
Tax History Compared to Growth
Tax History
| Year | Tax Paid | Tax Assessment Tax Assessment Total Assessment is a certain percentage of the fair market value that is determined by local assessors to be the total taxable value of land and additions on the property. | Land | Improvement |
|---|---|---|---|---|
| 2025 | $1,955 | $188,650 | $76,450 | $112,200 |
| 2024 | $1,874 | $182,050 | $60,500 | $121,550 |
| 2023 | $1,927 | $187,550 | $62,150 | $125,400 |
| 2022 | $1,978 | $349,000 | $96,000 | $253,000 |
| 2021 | $1,711 | $257,000 | $79,000 | $178,000 |
| 2020 | $1,547 | $225,000 | $74,700 | $150,300 |
| 2019 | $1,498 | $215,000 | $75,000 | $140,000 |
| 2018 | $1,354 | $193,000 | $85,000 | $108,000 |
| 2016 | $1,176 | $87,890 | $19,250 | $68,640 |
| 2015 | $1,131 | $80,520 | $19,250 | $61,270 |
| 2014 | $909 | $65,896 | $18,333 | $47,563 |
| 2013 | -- | $32,500 | $32,500 | $0 |
Source: Public Records
Map
Nearby Homes
- 1038 W 2050 S
- 1044 W 2050 S Unit 4
- 1044 W 2050 S
- 1036 W 2050 S
- 1046 W 2050 S
- 1048 W 2050 S Unit 11
- 2016 S 1000 W
- 1062 W 2050 S
- 1058 W 2050 S
- 1056 W 2050 S Unit 9
- 1056 W 2050 S
- 1054 W 2050 S
- 1052 W 2050 S
- 1039 W 2050 S
- 1027 W 2050 S Unit 63
- 1027 W 2050 S
- 1023 W 2050 S
- 1076 W 2050 S Unit 15
- 1047 W 2050 S
- 1074 W 2050 S