Estimated Value: $103,000 - $170,000
2
Beds
1
Bath
768
Sq Ft
$173/Sq Ft
Est. Value
About This Home
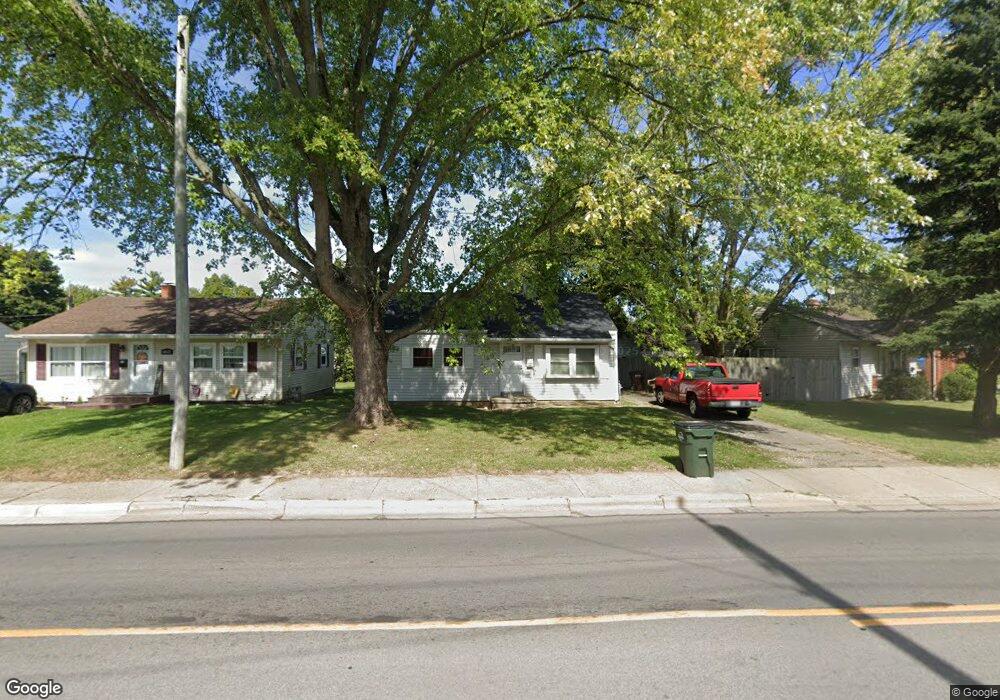
This home is located at 1042 W 2nd St, Xenia, OH 45385 and is currently estimated at $132,946, approximately $173 per square foot. 1042 W 2nd St is a home located in Greene County with nearby schools including Xenia High School, Summit Academy Community School for Alternative Learners - Xenia, and Legacy Christian Academy.
Ownership History
Date
Name
Owned For
Owner Type
Purchase Details
Closed on
Dec 4, 2019
Sold by
Vantress Thirl E and Vantress Penny L
Bought by
Baughn Brian K and Baughn Melissa L
Current Estimated Value
Purchase Details
Closed on
Dec 17, 2012
Sold by
Hughes Dustin C and Keithley Nicole R
Bought by
Vantress Thirl E and Vantress Penny L
Purchase Details
Closed on
May 30, 2002
Sold by
Smith Daniel and Smith Doris
Bought by
Hughes Dustin C and Keithley Nicole R
Home Financials for this Owner
Home Financials are based on the most recent Mortgage that was taken out on this home.
Original Mortgage
$58,580
Interest Rate
7%
Mortgage Type
FHA
Purchase Details
Closed on
Feb 4, 2000
Sold by
Ann Holton Dee and Ann De Ann
Bought by
Smith Daniel and Smith Doris
Home Financials for this Owner
Home Financials are based on the most recent Mortgage that was taken out on this home.
Original Mortgage
$52,970
Interest Rate
7.75%
Mortgage Type
Seller Take Back
Create a Home Valuation Report for This Property
The Home Valuation Report is an in-depth analysis detailing your home's value as well as a comparison with similar homes in the area
Home Values in the Area
Average Home Value in this Area
Purchase History
| Date | Buyer | Sale Price | Title Company |
|---|---|---|---|
| Baughn Brian K | $10,000 | None Available | |
| Vantress Thirl E | $9,900 | None Available | |
| Hughes Dustin C | $59,500 | -- | |
| Smith Daniel | $53,000 | -- | |
| Smith Daniel | $52,970 | -- |
Source: Public Records
Mortgage History
| Date | Status | Borrower | Loan Amount |
|---|---|---|---|
| Previous Owner | Hughes Dustin C | $58,580 | |
| Previous Owner | Smith Daniel | $52,970 |
Source: Public Records
Tax History Compared to Growth
Tax History
| Year | Tax Paid | Tax Assessment Tax Assessment Total Assessment is a certain percentage of the fair market value that is determined by local assessors to be the total taxable value of land and additions on the property. | Land | Improvement |
|---|---|---|---|---|
| 2024 | $1,395 | $32,610 | $8,270 | $24,340 |
| 2023 | $1,395 | $32,610 | $8,270 | $24,340 |
| 2022 | $1,140 | $22,730 | $5,910 | $16,820 |
| 2021 | $1,156 | $22,730 | $5,910 | $16,820 |
| 2020 | $1,107 | $22,730 | $5,910 | $16,820 |
| 2019 | $1,069 | $20,650 | $3,930 | $16,720 |
| 2018 | $1,073 | $20,650 | $3,930 | $16,720 |
| 2017 | $1,085 | $20,650 | $3,930 | $16,720 |
| 2016 | $1,033 | $19,520 | $3,930 | $15,590 |
| 2015 | $518 | $19,520 | $3,930 | $15,590 |
| 2014 | $992 | $19,520 | $3,930 | $15,590 |
Source: Public Records
Map
Nearby Homes
- 1223 June Dr
- 1233 June Dr
- 1342 Kylemore Dr
- 1283 June Dr
- 305-325 Bellbrook Ave
- 1391 June Dr
- 1144 Rockwell Dr
- 453 Walnut St
- 343 Sheelin Rd
- 1208 Bellbrook Ave
- 883 Omard Dr
- 509 Antrim Rd
- 912 Omard Dr
- 1351 Omard Dr
- 1272 Bellbrook Ave
- 293 S Miami Ave
- 1568 Cheyenne Dr
- 0 W Church St
- 1618 Navajo Dr
- 98 W 3rd St