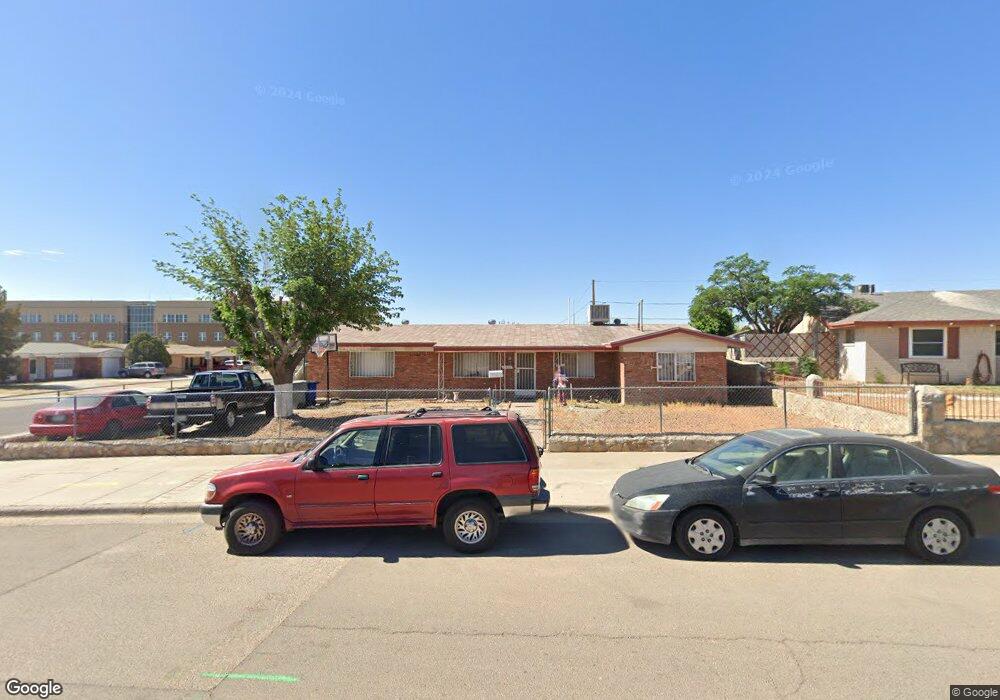
10420 Cirwood Dr El Paso, TX 79935
Pico Norte NeighborhoodEstimated Value: $211,562 - $238,000
--
Bed
2
Baths
1,578
Sq Ft
$142/Sq Ft
Est. Value
About This Home
This home is located at 10420 Cirwood Dr, El Paso, TX 79935 and is currently estimated at $223,641, approximately $141 per square foot. 10420 Cirwood Dr is a home located in El Paso County with nearby schools including East Point Elementary School, Eastwood Middle School, and Eastwood High School.
Ownership History
Date
Name
Owned For
Owner Type
Purchase Details
Closed on
Jul 31, 2017
Sold by
Rice Inez Irene and Strickland Cecil V
Bought by
Rice Inez Irene
Current Estimated Value
Home Financials for this Owner
Home Financials are based on the most recent Mortgage that was taken out on this home.
Original Mortgage
$44,000
Outstanding Balance
$36,655
Interest Rate
3.9%
Mortgage Type
Purchase Money Mortgage
Estimated Equity
$186,986
Purchase Details
Closed on
Jul 28, 2017
Sold by
Strickland Vernon Wayne and Rhoades Cecilia Claudine
Bought by
Mack Dustin Lee
Home Financials for this Owner
Home Financials are based on the most recent Mortgage that was taken out on this home.
Original Mortgage
$44,000
Outstanding Balance
$36,655
Interest Rate
3.9%
Mortgage Type
Purchase Money Mortgage
Estimated Equity
$186,986
Purchase Details
Closed on
Nov 29, 2011
Sold by
Strickland Mary E
Bought by
Strickland Vernon Wayne and Rhoades Cecilia Claudine
Create a Home Valuation Report for This Property
The Home Valuation Report is an in-depth analysis detailing your home's value as well as a comparison with similar homes in the area
Home Values in the Area
Average Home Value in this Area
Purchase History
| Date | Buyer | Sale Price | Title Company |
|---|---|---|---|
| Rice Inez Irene | -- | None Available | |
| Mack Dustin Lee | -- | None Available | |
| Strickland Vernon Wayne | -- | None Available |
Source: Public Records
Mortgage History
| Date | Status | Borrower | Loan Amount |
|---|---|---|---|
| Open | Mack Dustin Lee | $44,000 |
Source: Public Records
Tax History Compared to Growth
Tax History
| Year | Tax Paid | Tax Assessment Tax Assessment Total Assessment is a certain percentage of the fair market value that is determined by local assessors to be the total taxable value of land and additions on the property. | Land | Improvement |
|---|---|---|---|---|
| 2025 | $3,060 | $191,400 | -- | -- |
| 2024 | $3,060 | $174,000 | $26,229 | $147,771 |
| 2023 | $2,986 | $163,172 | $26,229 | $136,943 |
| 2022 | $5,415 | $174,368 | $0 | $0 |
| 2021 | $5,153 | $158,516 | $26,229 | $132,287 |
| 2020 | $4,738 | $149,997 | $18,735 | $131,262 |
| 2018 | $4,672 | $150,248 | $18,735 | $131,513 |
| 2017 | $4,223 | $138,159 | $18,735 | $119,424 |
| 2016 | $4,223 | $138,159 | $18,735 | $119,424 |
| 2015 | $1,875 | $138,159 | $18,735 | $119,424 |
| 2014 | $1,875 | $138,602 | $18,735 | $119,867 |
Source: Public Records
Map
Nearby Homes
- 2701 Brady Place
- 2801 Brady Place
- 2912 Chaswood St
- 10512 Album Ave
- 2412 Penwood Dr
- 3000 Woodall St
- 3101 Vogue Dr
- 10304 Blackwood Ave
- 3150 N Yarbrough Dr Unit A1
- 2224 Escarpa Dr
- 10301 Bayo Ave
- 3112 Eads Place
- 10309 Woodruff Ct
- 10304 Woodruff Ct
- 2105 Pacheco Dr
- 10145 Singapore Ave
- 3213 Isla Cocoa Ln
- 10140 Suez Dr
- 2109 Febrero Dr
- 10712 Gay Brewer Dr
- 10416 Cirwood Dr
- 10427 Bywood Dr
- 10423 Bywood Dr
- 10412 Cirwood Dr
- 2712 Chaswood St
- 10417 Bywood Dr
- 2708 Chaswood St
- 10419 Cirwood Dr
- 2716 Chaswood St
- 10413 Bywood Dr
- 2700 Chaswood St
- 10413 Cirwood Dr
- 2800 Chaswood St
- 10408 Cirwood Dr
- 10409 Bywood Dr
- 2709 Archie Dr
- 10409 Cirwood Dr
- 2804 Chaswood St
- 2705 Archie Dr
- 2809 Chaswood St