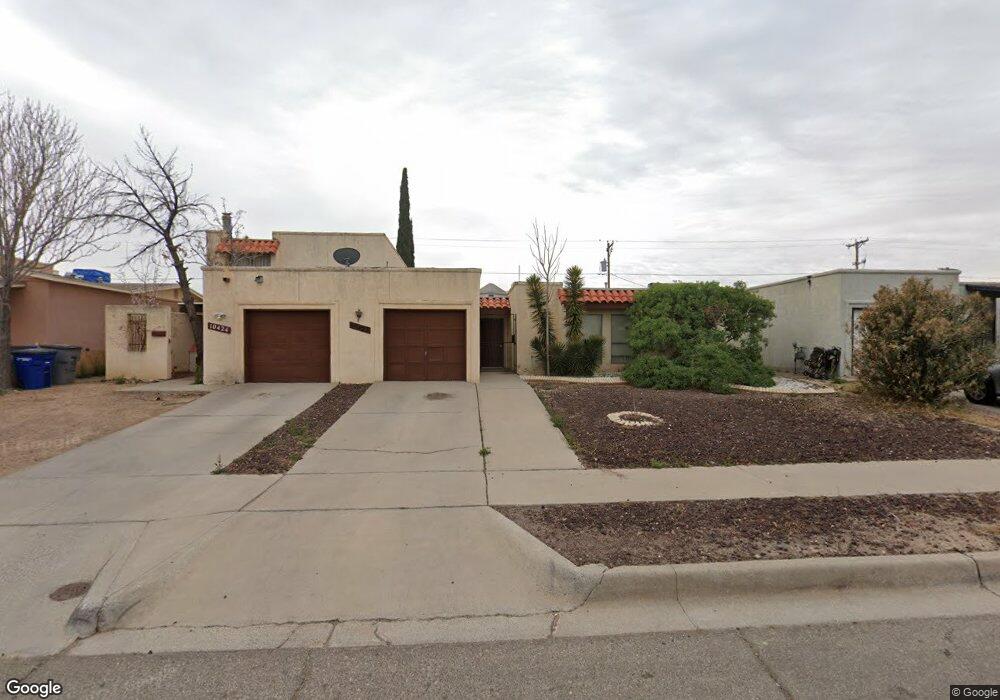
10422 Ashwood Dr El Paso, TX 79935
Pico Norte NeighborhoodEstimated Value: $183,000 - $419,000
3
Beds
2
Baths
1,501
Sq Ft
$166/Sq Ft
Est. Value
About This Home
This home is located at 10422 Ashwood Dr, El Paso, TX 79935 and is currently estimated at $248,775, approximately $165 per square foot. 10422 Ashwood Dr is a home located in El Paso County with nearby schools including East Point Elementary School, Eastwood Middle School, and Eastwood High School.
Ownership History
Date
Name
Owned For
Owner Type
Purchase Details
Closed on
Dec 16, 2003
Sold by
Alston Maurice W
Bought by
Alston Maurice W and Alston Dollye P
Current Estimated Value
Home Financials for this Owner
Home Financials are based on the most recent Mortgage that was taken out on this home.
Original Mortgage
$62,000
Outstanding Balance
$25,432
Interest Rate
4.25%
Mortgage Type
VA
Estimated Equity
$223,343
Purchase Details
Closed on
Oct 16, 1998
Sold by
Esper Ramsey
Bought by
Alston Maurice W
Home Financials for this Owner
Home Financials are based on the most recent Mortgage that was taken out on this home.
Original Mortgage
$60,500
Interest Rate
6.85%
Purchase Details
Closed on
Jul 17, 1998
Sold by
Ashley Murray
Bought by
Esper Ramsey
Home Financials for this Owner
Home Financials are based on the most recent Mortgage that was taken out on this home.
Original Mortgage
$250,000
Interest Rate
7.09%
Create a Home Valuation Report for This Property
The Home Valuation Report is an in-depth analysis detailing your home's value as well as a comparison with similar homes in the area
Home Values in the Area
Average Home Value in this Area
Purchase History
| Date | Buyer | Sale Price | Title Company |
|---|---|---|---|
| Alston Maurice W | -- | -- | |
| Alston Maurice W | -- | -- | |
| Esper Ramsey | -- | -- |
Source: Public Records
Mortgage History
| Date | Status | Borrower | Loan Amount |
|---|---|---|---|
| Open | Alston Maurice W | $62,000 | |
| Previous Owner | Alston Maurice W | $60,500 | |
| Previous Owner | Esper Ramsey | $250,000 |
Source: Public Records
Tax History Compared to Growth
Tax History
| Year | Tax Paid | Tax Assessment Tax Assessment Total Assessment is a certain percentage of the fair market value that is determined by local assessors to be the total taxable value of land and additions on the property. | Land | Improvement |
|---|---|---|---|---|
| 2025 | $3,829 | $160,437 | $37,804 | $122,633 |
| 2024 | $3,829 | $139,425 | $16,792 | $122,633 |
| 2023 | $3,763 | $129,296 | $16,792 | $112,504 |
| 2022 | $3,566 | $114,822 | $16,792 | $98,030 |
| 2021 | $3,404 | $104,733 | $16,792 | $87,941 |
| 2020 | $2,564 | $81,165 | $9,860 | $71,305 |
| 2018 | $2,524 | $81,165 | $9,860 | $71,305 |
| 2017 | $2,438 | $79,771 | $9,860 | $69,911 |
| 2016 | $2,348 | $76,827 | $9,860 | $66,967 |
| 2015 | $2,388 | $76,827 | $9,860 | $66,967 |
| 2014 | $2,388 | $83,450 | $9,860 | $73,590 |
Source: Public Records
Map
Nearby Homes
- 2412 Penwood Dr
- 10309 Woodruff Ct
- 10304 Woodruff Ct
- 10512 Album Ave
- 2224 Escarpa Dr
- 2701 Brady Place
- 10313 Byway Dr
- 2105 Pacheco Dr
- 2801 Brady Place
- 10233 Byway Dr
- 10145 Camwood Dr
- 1909 Crow Dr
- 2705 Fierro Dr
- 2109 Febrero Dr
- 2912 Chaswood St
- 3000 Woodall St
- 10603 Park View Cir
- 10145 Singapore Ave
- 10140 Suez Dr
- 1955 Trawood Dr Unit 12
- 10424 Ashwood Dr
- 10420 Ashwood Dr
- 10426 Ashwood Dr
- 10418 Ashwood Dr
- 10428 Ashwood Dr
- 10416 Ashwood Dr
- 10414 Ashwood Dr
- 10421 Ashwood Dr Unit B
- 10421 Ashwood Dr Unit C
- 10421 Ashwood Dr Unit A
- 10421 Ashwood Dr Unit ABC
- 10421 Ashwood Dr Unit ABCD
- 10421 Ashwood Dr Unit D
- 10425 Ashwood Dr Unit A
- 10425 Ashwood Dr Unit D
- 10417 Ashwood Dr
- 10412 Ashwood Dr
- 10410 Ashwood Dr
- 10415 Ashwood Dr Unit AB
- 10415 Ashwood Dr Unit B