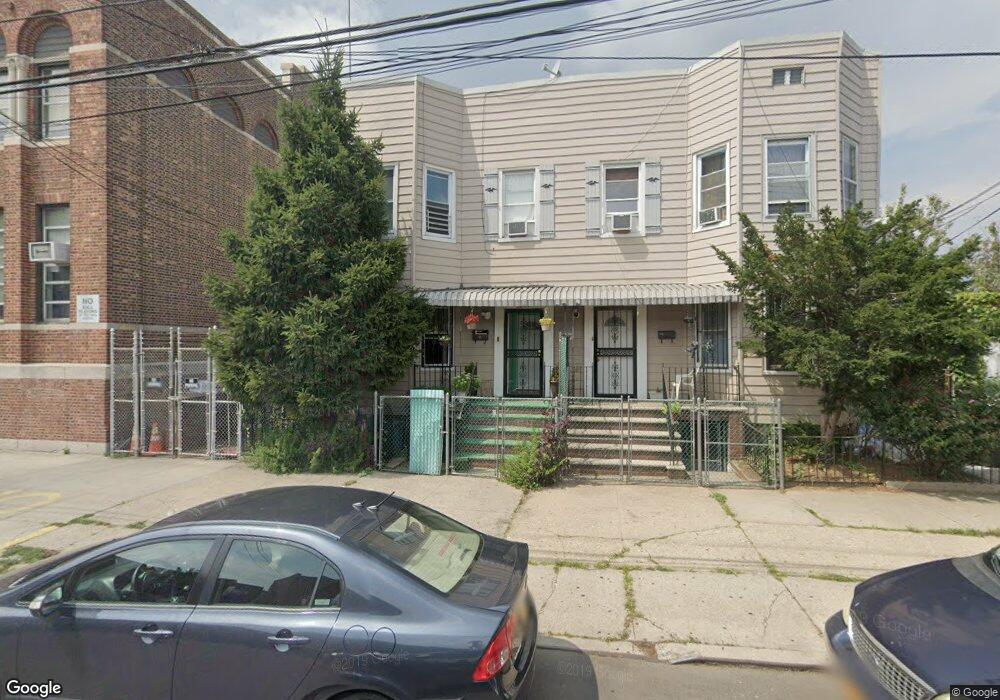
10427 49th Ave Corona, NY 11368
Corona NeighborhoodEstimated Value: $1,049,403 - $1,282,000
--
Bed
--
Bath
2,096
Sq Ft
$539/Sq Ft
Est. Value
About This Home
This home is located at 10427 49th Ave, Corona, NY 11368 and is currently estimated at $1,129,851, approximately $539 per square foot. 10427 49th Ave is a home located in Queens County with nearby schools including Is 61 Leonardo Da Vinci, Flushing High School, and St. Leo Elementary School.
Ownership History
Date
Name
Owned For
Owner Type
Purchase Details
Closed on
Feb 15, 2011
Sold by
Morel Jennie V and Morel Rafael
Bought by
Morel Jennie V and Morel Rosa Y
Current Estimated Value
Purchase Details
Closed on
Jul 31, 2008
Sold by
Richard P Tamberino Living Trust and Richard P Tamberino Trustee
Bought by
Morel Jennie V and Morel Rafael
Home Financials for this Owner
Home Financials are based on the most recent Mortgage that was taken out on this home.
Original Mortgage
$571,076
Interest Rate
6.4%
Mortgage Type
Purchase Money Mortgage
Purchase Details
Closed on
Aug 9, 2000
Sold by
Tamberino Richard P
Bought by
Tamberino Richard P and Richard P Tamberino Living Trust
Purchase Details
Closed on
May 5, 1999
Sold by
Tamberino Philip and Tamberino Johanna
Bought by
Tamberino Richard P
Create a Home Valuation Report for This Property
The Home Valuation Report is an in-depth analysis detailing your home's value as well as a comparison with similar homes in the area
Home Values in the Area
Average Home Value in this Area
Purchase History
| Date | Buyer | Sale Price | Title Company |
|---|---|---|---|
| Morel Jennie V | -- | -- | |
| Morel Jennie | -- | -- | |
| Morel Jennie V | $592,250 | -- | |
| Morel Jennie | $592,250 | -- | |
| Tamberino Richard P | -- | -- | |
| Tamberino Richard P | -- | -- | |
| Tamberino Richard P | -- | First American Title Ins Co | |
| Tamberino Richard P | -- | First American Title Ins Co |
Source: Public Records
Mortgage History
| Date | Status | Borrower | Loan Amount |
|---|---|---|---|
| Previous Owner | Morel Jennie | $571,076 |
Source: Public Records
Tax History Compared to Growth
Tax History
| Year | Tax Paid | Tax Assessment Tax Assessment Total Assessment is a certain percentage of the fair market value that is determined by local assessors to be the total taxable value of land and additions on the property. | Land | Improvement |
|---|---|---|---|---|
| 2025 | $7,772 | $40,988 | $6,158 | $34,830 |
| 2024 | $7,772 | $38,695 | $6,083 | $32,612 |
| 2023 | $7,340 | $36,547 | $5,696 | $30,851 |
| 2022 | $6,952 | $61,440 | $10,800 | $50,640 |
| 2021 | $7,329 | $61,020 | $10,800 | $50,220 |
| 2020 | $7,230 | $60,240 | $10,800 | $49,440 |
| 2019 | $6,746 | $61,440 | $10,800 | $50,640 |
| 2018 | $6,208 | $30,456 | $6,412 | $24,044 |
| 2017 | $5,916 | $29,020 | $6,465 | $22,555 |
| 2016 | $5,801 | $29,020 | $6,465 | $22,555 |
| 2015 | $3,302 | $28,464 | $9,849 | $18,615 |
| 2014 | $3,302 | $26,872 | $9,736 | $17,136 |
Source: Public Records
Map
Nearby Homes
- 104-47 49th Ave
- 104-49 49th Ave
- 10603 49th Ave
- 10605 49th Ave
- 4913 106th St
- 10464 48th Ave
- 102-62 Nicolls Ave
- 104-20 47th Ave
- 104-73 48th Ave
- 102-48 Nicolls Ave
- 106-16 Corona Ave
- 103-26 Alstyne Ave
- 102-29 Nicolls Ave Unit 2A
- 102-56 46th Ave
- 108-25 48th Ave
- 108-19 48th Ave
- 50-41 103rd St
- 45-09 104th St
- 10337 52nd Ave
- 10827 50th Ave
- 10429 49th Ave
- 10436 48th Ave
- 10441 49th Ave
- 10438 48th Ave
- 10424 48th Ave
- 10428 49th Ave
- 10420 49th Ave
- 10420 49th Ave Unit 3Fl
- 10420 49th Ave Unit 2Fl
- 10420 49th Ave
- 10420 49th Ave
- 10440 48th Ave
- 4910 106th St
- 10418 49th Ave
- 10418 49th Ave
- 4906 106th St
- 10443 49th Ave
- 10443 49th Ave
- 4912 106th St
- 49-22 106th St