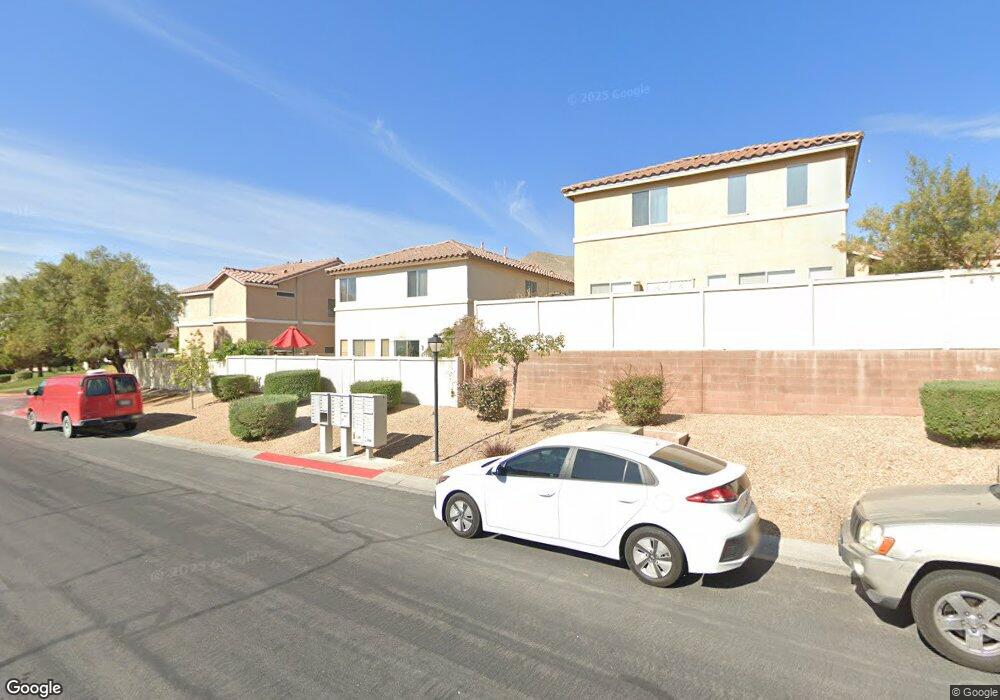
10428 Chrisman Ave Las Vegas, NV 89129
Lone Mountain NeighborhoodEstimated Value: $377,015 - $395,000
3
Beds
3
Baths
1,572
Sq Ft
$246/Sq Ft
Est. Value
About This Home
This home is located at 10428 Chrisman Ave, Las Vegas, NV 89129 and is currently estimated at $386,504, approximately $245 per square foot. 10428 Chrisman Ave is a home located in Clark County with nearby schools including Eileen Conners Elementary School, Justice Myron E Leavitt Middle School, and Centennial High School.
Ownership History
Date
Name
Owned For
Owner Type
Purchase Details
Closed on
Nov 10, 2014
Sold by
Harmon Carol A
Bought by
Harmon Carol A and Harmon 1979 Trust
Current Estimated Value
Purchase Details
Closed on
Oct 29, 2010
Sold by
Mccallen Becky J
Bought by
Harmon Thomas C
Home Financials for this Owner
Home Financials are based on the most recent Mortgage that was taken out on this home.
Original Mortgage
$82,500
Interest Rate
4.33%
Mortgage Type
New Conventional
Purchase Details
Closed on
Oct 27, 2010
Sold by
Harmon Carol
Bought by
Harmon Thomas C
Home Financials for this Owner
Home Financials are based on the most recent Mortgage that was taken out on this home.
Original Mortgage
$82,500
Interest Rate
4.33%
Mortgage Type
New Conventional
Purchase Details
Closed on
May 23, 2006
Sold by
Knisely Kevin J
Bought by
Mccallen Becky J
Home Financials for this Owner
Home Financials are based on the most recent Mortgage that was taken out on this home.
Original Mortgage
$255,200
Interest Rate
6.75%
Mortgage Type
Unknown
Create a Home Valuation Report for This Property
The Home Valuation Report is an in-depth analysis detailing your home's value as well as a comparison with similar homes in the area
Home Values in the Area
Average Home Value in this Area
Purchase History
| Date | Buyer | Sale Price | Title Company |
|---|---|---|---|
| Harmon Carol A | -- | None Available | |
| Harmon Thomas C | $110,000 | Lawyers Title Of Nevada Mid | |
| Harmon Thomas C | -- | Lawyers Title Of Nevada Mid | |
| Mccallen Becky J | $319,000 | Equity Title Of Nevada |
Source: Public Records
Mortgage History
| Date | Status | Borrower | Loan Amount |
|---|---|---|---|
| Previous Owner | Harmon Thomas C | $82,500 | |
| Previous Owner | Mccallen Becky J | $255,200 |
Source: Public Records
Tax History Compared to Growth
Tax History
| Year | Tax Paid | Tax Assessment Tax Assessment Total Assessment is a certain percentage of the fair market value that is determined by local assessors to be the total taxable value of land and additions on the property. | Land | Improvement |
|---|---|---|---|---|
| 2025 | $1,461 | $97,172 | $31,850 | $65,322 |
| 2024 | $1,419 | $97,172 | $31,850 | $65,322 |
| 2023 | $1,157 | $91,421 | $29,750 | $61,671 |
| 2022 | $1,377 | $79,723 | $23,450 | $56,273 |
| 2021 | $1,337 | $74,480 | $21,000 | $53,480 |
| 2020 | $1,295 | $73,997 | $21,000 | $52,997 |
| 2019 | $1,280 | $70,231 | $18,200 | $52,031 |
| 2018 | $1,221 | $63,479 | $13,650 | $49,829 |
| 2017 | $2,065 | $62,999 | $12,600 | $50,399 |
| 2016 | $1,157 | $52,768 | $10,150 | $42,618 |
| 2015 | $1,154 | $44,366 | $8,400 | $35,966 |
| 2014 | $1,118 | $36,104 | $5,250 | $30,854 |
Source: Public Records
Map
Nearby Homes
- 3908 Badgerbrook St
- 3929 Philomena St
- 3945 Bayamon St
- 10365 Cherokee Corner Ave
- 10425 Denali Ridge Ct
- 10429 Chandra Ave
- 10400 Coyote Cub Ave
- 10404 Coyote Cub Ave
- 3935 Legend Hills St Unit 104
- 10290 Gilmore Canyon Ct Unit 103
- 3908 Total Eclipse St
- 3920 Legend Hills St Unit 202
- 4033 Baxter Peak St
- 3930 Legend Hills St Unit 102
- 10413 Cole Younger Ct
- 3915 Palm Beach St Unit 201
- 10231 Delray Beach Ave Unit 201
- 10221 Delray Beach Ave Unit 201
- 10544 Headwind Ave
- 10476 Wellington Manor Ave Unit 5
- 10429 Armand Ave
- 10424 Chrisman Ave
- 10432 Chrisman Ave
- 10433 Armand Ave
- 10436 Chrisman Ave
- 10425 Armand Ave
- 10437 Armand Ave
- 3912 Badgerbrook St
- 10444 Chrisman Ave
- 3900 Badgerbrook St
- 10445 Armand Ave
- 10440 Chrisman Ave
- 3920 Badgerbrook St
- 3876 Badger Brook St
- 10441 Armand Ave
- 10441 Armand Ave Unit None
- 3876 Badgerbrook St
- 10433 Chrisman Ave
- 3908 Badgerbrook St Unit n/a
- 3904 Badgerbrook St