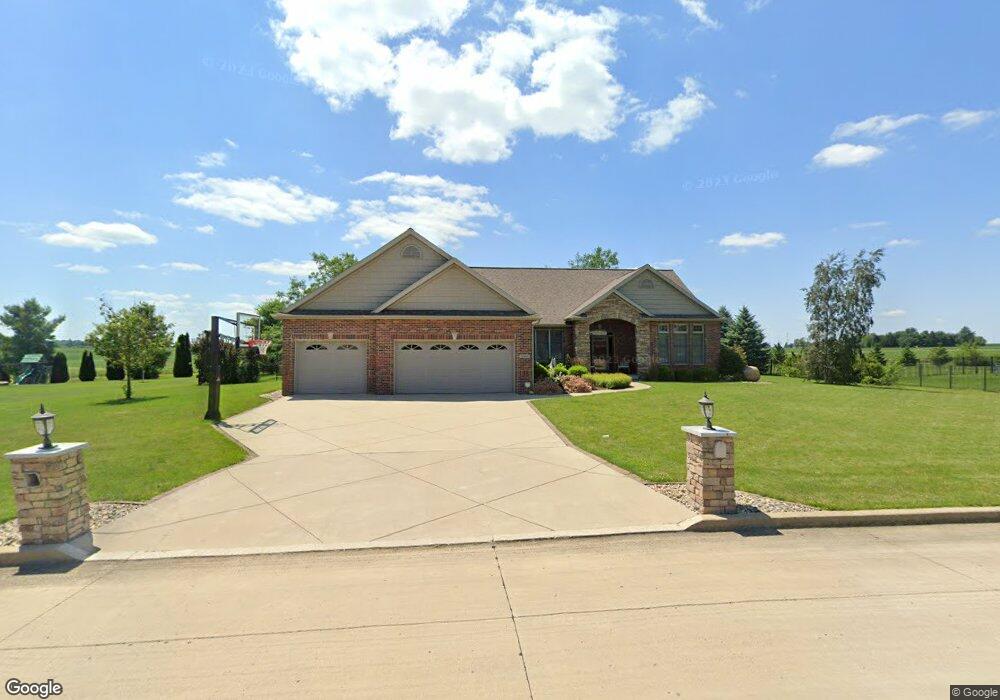
10428 Lyonheart Ln Bloomington, IL 61705
Estimated Value: $479,000 - $693,000
1
Bed
3
Baths
2,492
Sq Ft
$222/Sq Ft
Est. Value
About This Home
This home is located at 10428 Lyonheart Ln, Bloomington, IL 61705 and is currently estimated at $552,558, approximately $221 per square foot. 10428 Lyonheart Ln is a home located in McLean County with nearby schools including Tri-Valley Elementary School, Tri-Valley Middle School, and Tri-Valley High School.
Ownership History
Date
Name
Owned For
Owner Type
Purchase Details
Closed on
May 20, 2019
Sold by
Essman William Henry and Essman Cynthia
Bought by
Hayes Dustin R and Hayes Andrea N
Current Estimated Value
Home Financials for this Owner
Home Financials are based on the most recent Mortgage that was taken out on this home.
Original Mortgage
$255,000
Outstanding Balance
$195,457
Interest Rate
4.1%
Estimated Equity
$357,101
Purchase Details
Closed on
Dec 27, 2007
Sold by
Oconnor Homes Realty Llc
Bought by
Essman William Henry and Essman Cynthia
Home Financials for this Owner
Home Financials are based on the most recent Mortgage that was taken out on this home.
Original Mortgage
$223,872
Interest Rate
6.27%
Purchase Details
Closed on
Apr 1, 2006
Sold by
Hundman Laurence F
Bought by
Oconnor Homes Realty Llc
Home Financials for this Owner
Home Financials are based on the most recent Mortgage that was taken out on this home.
Original Mortgage
$297,500
Interest Rate
6.55%
Create a Home Valuation Report for This Property
The Home Valuation Report is an in-depth analysis detailing your home's value as well as a comparison with similar homes in the area
Home Values in the Area
Average Home Value in this Area
Purchase History
| Date | Buyer | Sale Price | Title Company |
|---|---|---|---|
| Hayes Dustin R | $385,000 | Attorney | |
| Essman William Henry | $314,000 | None Available | |
| Oconnor Homes Realty Llc | $57,000 | None Available |
Source: Public Records
Mortgage History
| Date | Status | Borrower | Loan Amount |
|---|---|---|---|
| Open | Hayes Dustin R | $255,000 | |
| Previous Owner | Essman William Henry | $223,872 | |
| Previous Owner | Oconnor Homes Realty Llc | $297,500 |
Source: Public Records
Tax History Compared to Growth
Tax History
| Year | Tax Paid | Tax Assessment Tax Assessment Total Assessment is a certain percentage of the fair market value that is determined by local assessors to be the total taxable value of land and additions on the property. | Land | Improvement |
|---|---|---|---|---|
| 2024 | $10,458 | $153,631 | $26,596 | $127,035 |
| 2022 | $10,458 | $131,448 | $22,756 | $108,692 |
| 2021 | $10,101 | $126,417 | $21,885 | $104,532 |
| 2020 | $10,112 | $126,417 | $21,885 | $104,532 |
| 2019 | $9,610 | $120,417 | $21,885 | $98,532 |
| 2018 | $9,536 | $119,473 | $21,713 | $97,760 |
| 2017 | $9,376 | $117,464 | $21,348 | $96,116 |
| 2016 | $9,316 | $116,381 | $21,151 | $95,230 |
| 2015 | $9,985 | $124,810 | $17,433 | $107,377 |
| 2014 | $9,360 | $122,231 | $17,073 | $105,158 |
| 2013 | -- | $122,231 | $17,073 | $105,158 |
Source: Public Records
Map
Nearby Homes
- 19977 Jared Dr
- 19863 Jared Dr
- 19107 Brentwood Dr
- 19889 Jared Dr
- 9222 Abbey Way
- 3903 Dunloe Place
- 1411 Watersound Way
- 1922 Dunraven Rd
- 1906 Dunraven Rd
- 1815 Glenbridge Rd
- 19683 Chelsea Way
- 1805 Glenbridge Rd
- 1525 Stoneroller Cir
- 1713 Dunraven Rd
- 1520 Stoneroller Cir
- 5005 Finlen Ln
- 5017 Finlen Ln
- 5311 Finlen Ln
- 1002 Mount Carmel Rd
- 1004 Mount Carmel Rd
- 10456 Lyonheart Ln
- 10400 Lyonheart Ln
- 10456 Lyonheart Ln
- 10423 Lyonheart Ln
- 10453 Lyonheart Ln
- 10484 Lyonheart Ln
- 10393 Lyonheart Ln
- 10483 Lyonheart Ln
- 9364 Fenwick Dr
- 9306 Fenwick Dr
- 9392 Fenwick Dr
- 10393 Lyonheart Rd
- 9336 Fenwick Dr
- 10363 Lyonheart Ln
- 9420 Fenwick Dr
- 10372 Lyonheart Rd
- 10512 Lyonheart Ln
- 10513 Lyonheart Ln
- LOT 32 Fenwick Dr
- 9308 Fenwick Dr