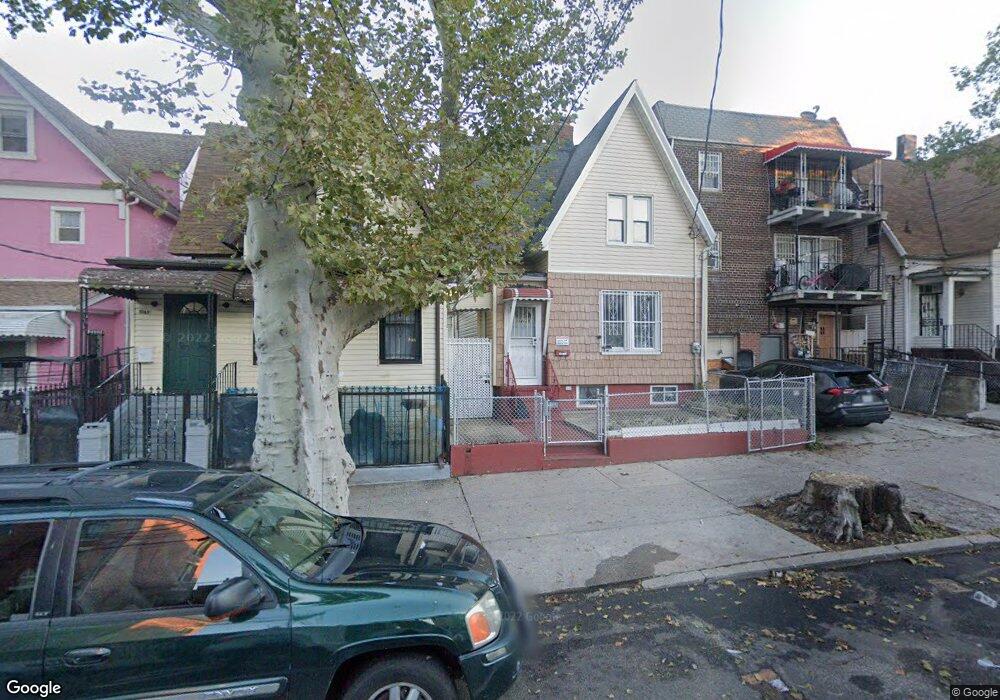
10429 41st Ave Corona, NY 11368
Corona NeighborhoodEstimated Value: $939,000 - $1,058,000
--
Bed
--
Bath
1,898
Sq Ft
$518/Sq Ft
Est. Value
About This Home
This home is located at 10429 41st Ave, Corona, NY 11368 and is currently estimated at $983,319, approximately $518 per square foot. 10429 41st Ave is a home located in Queens County with nearby schools including P.S. 16 the Nancy Debenedittis School, Is 61 Leonardo Da Vinci, and Flushing High School.
Ownership History
Date
Name
Owned For
Owner Type
Purchase Details
Closed on
Jun 27, 2001
Sold by
First Home Properties Ll
Bought by
Sukhhiran Janya and Sukhhiran Somsak
Current Estimated Value
Home Financials for this Owner
Home Financials are based on the most recent Mortgage that was taken out on this home.
Original Mortgage
$252,000
Outstanding Balance
$97,397
Interest Rate
7.18%
Mortgage Type
Purchase Money Mortgage
Estimated Equity
$885,922
Purchase Details
Closed on
Mar 15, 2001
Sold by
Zhu Michael Hsiao Kuang and Chao Grace
Bought by
First Home Equities Llc
Purchase Details
Closed on
Sep 5, 1995
Sold by
Zhu Heung Yeun and Zhu Shu Chen
Bought by
Zhu Michael Hsiao Kuang and Chao Grace
Home Financials for this Owner
Home Financials are based on the most recent Mortgage that was taken out on this home.
Original Mortgage
$120,000
Interest Rate
7.86%
Mortgage Type
Purchase Money Mortgage
Create a Home Valuation Report for This Property
The Home Valuation Report is an in-depth analysis detailing your home's value as well as a comparison with similar homes in the area
Home Values in the Area
Average Home Value in this Area
Purchase History
| Date | Buyer | Sale Price | Title Company |
|---|---|---|---|
| Sukhhiran Janya | -- | -- | |
| Sukhhiran Janya | -- | -- | |
| First Home Equities Llc | -- | -- | |
| First Home Equities Llc | -- | -- | |
| Zhu Michael Hsiao Kuang | $150,000 | Chicago Title Insurance Co | |
| Zhu Michael Hsiao Kuang | -- | Chicago Title Insurance Co |
Source: Public Records
Mortgage History
| Date | Status | Borrower | Loan Amount |
|---|---|---|---|
| Open | Sukhhiran Janya | $252,000 | |
| Closed | Sukhhiran Janya | $252,000 | |
| Previous Owner | Zhu Michael Hsiao Kuang | $120,000 |
Source: Public Records
Tax History Compared to Growth
Tax History
| Year | Tax Paid | Tax Assessment Tax Assessment Total Assessment is a certain percentage of the fair market value that is determined by local assessors to be the total taxable value of land and additions on the property. | Land | Improvement |
|---|---|---|---|---|
| 2025 | $5,279 | $29,342 | $4,578 | $24,764 |
| 2024 | $5,291 | $27,684 | $5,177 | $22,507 |
| 2023 | $5,020 | $26,392 | $4,168 | $22,224 |
| 2022 | $4,724 | $61,080 | $11,580 | $49,500 |
| 2021 | $4,987 | $65,340 | $11,580 | $53,760 |
| 2020 | $4,880 | $60,000 | $11,580 | $48,420 |
| 2019 | $4,533 | $53,460 | $11,580 | $41,880 |
| 2018 | $4,186 | $21,993 | $6,770 | $15,223 |
| 2017 | $3,964 | $20,918 | $5,851 | $15,067 |
| 2016 | $3,872 | $20,918 | $5,851 | $15,067 |
| 2015 | $2,160 | $20,377 | $7,332 | $13,045 |
| 2014 | $2,160 | $19,225 | $7,116 | $12,109 |
Source: Public Records
Map
Nearby Homes
- 104-61 Roosevelt Ave
- 104-32 39th Ave
- 104-60 Roosevelt Ave
- 104-64 39th Ave Unit 3A
- 104-68 39th Ave
- 104-21 39th Ave Unit 211C
- 104-40 41st Ave
- 104-12 38th Ave
- 104-65 42nd Ave
- 104-48 37th Dr Unit 3A
- 108-22 38th Ave
- 108-20 38th Ave
- 37-45 108th St
- 4211 108th St Unit 1A
- 108-38 41st Ave Unit 1A
- 108-38 41st Ave Unit 4A
- 101-20 39th Ave
- 37-33 107th St Unit 2A
- 37-33 107th St Unit 4A
- 10842 41st Ave
- 10427 41st Ave
- 10431 41st Ave
- 10423 41st Ave
- 10433 41st Ave
- 104-23 41st Ave Unit 2FL
- 10421 41st Ave
- 10437 41st Ave
- 10439 41st Ave
- 10419 41st Ave
- 10432 Roosevelt Ave
- 10426 Roosevelt Ave
- 10428 Roosevelt Ave
- 10424 Roosevelt Ave
- 10434 Roosevelt Ave
- 10430 Roosevelt Ave
- 10441 41st Ave
- 10417 41st Ave
- 10422 Roosevelt Ave
- 10438 Roosevelt Ave
- 10420 Roosevelt Ave