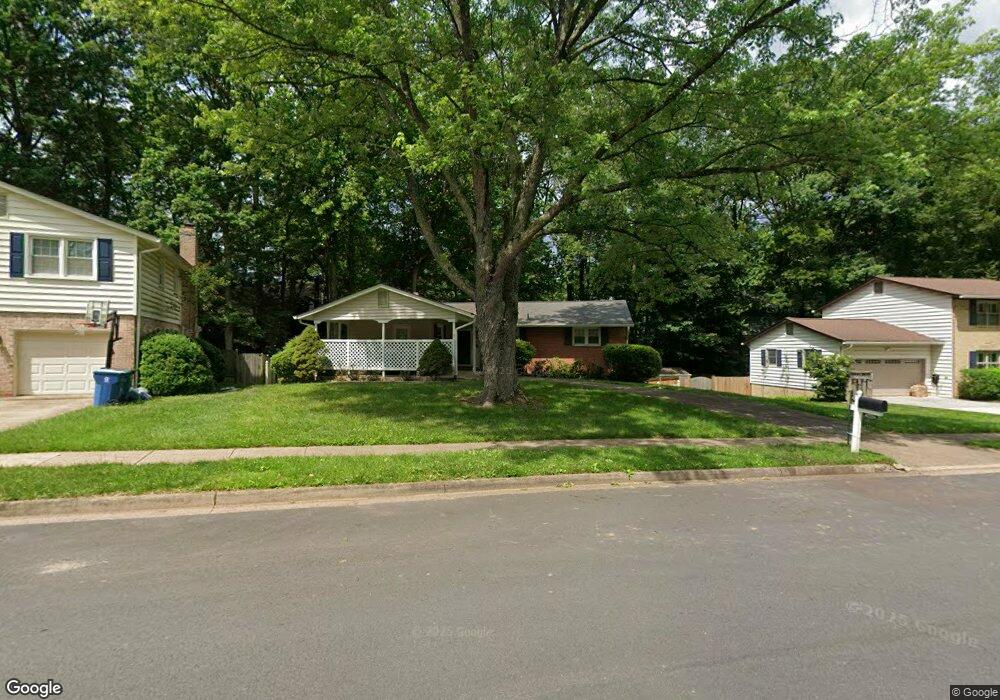
10429 Finchley Ct Fairfax, VA 22032
Estimated Value: $777,375 - $941,000
4
Beds
3
Baths
1,468
Sq Ft
$569/Sq Ft
Est. Value
About This Home
This home is located at 10429 Finchley Ct, Fairfax, VA 22032 and is currently estimated at $834,594, approximately $568 per square foot. 10429 Finchley Ct is a home located in Fairfax County with nearby schools including Oak View Elementary School, James W Robinson, Jr. Secondary School, and St Anthony Academy.
Ownership History
Date
Name
Owned For
Owner Type
Purchase Details
Closed on
May 24, 2007
Sold by
Christianson Douglas
Bought by
Charnley Deborah H
Current Estimated Value
Home Financials for this Owner
Home Financials are based on the most recent Mortgage that was taken out on this home.
Original Mortgage
$170,000
Outstanding Balance
$103,969
Interest Rate
6.27%
Mortgage Type
New Conventional
Estimated Equity
$730,625
Purchase Details
Closed on
Sep 3, 2004
Sold by
Moore Drue B
Bought by
Christianson Douglas
Home Financials for this Owner
Home Financials are based on the most recent Mortgage that was taken out on this home.
Original Mortgage
$333,700
Interest Rate
6.08%
Mortgage Type
New Conventional
Create a Home Valuation Report for This Property
The Home Valuation Report is an in-depth analysis detailing your home's value as well as a comparison with similar homes in the area
Home Values in the Area
Average Home Value in this Area
Purchase History
| Date | Buyer | Sale Price | Title Company |
|---|---|---|---|
| Charnley Deborah H | $491,000 | -- | |
| Christianson Douglas | $422,000 | -- |
Source: Public Records
Mortgage History
| Date | Status | Borrower | Loan Amount |
|---|---|---|---|
| Open | Charnley Deborah H | $170,000 | |
| Previous Owner | Christianson Douglas | $333,700 |
Source: Public Records
Tax History Compared to Growth
Tax History
| Year | Tax Paid | Tax Assessment Tax Assessment Total Assessment is a certain percentage of the fair market value that is determined by local assessors to be the total taxable value of land and additions on the property. | Land | Improvement |
|---|---|---|---|---|
| 2025 | $8,285 | $730,070 | $285,000 | $445,070 |
| 2024 | $8,285 | $715,170 | $280,000 | $435,170 |
| 2023 | $7,960 | $705,380 | $280,000 | $425,380 |
| 2022 | $6,915 | $604,760 | $255,000 | $349,760 |
| 2021 | $6,530 | $556,480 | $235,000 | $321,480 |
| 2020 | $6,330 | $534,880 | $220,000 | $314,880 |
| 2019 | $6,166 | $521,000 | $215,000 | $306,000 |
| 2018 | $5,931 | $515,730 | $215,000 | $300,730 |
| 2017 | $5,780 | $497,820 | $205,000 | $292,820 |
| 2016 | $5,493 | $474,140 | $190,000 | $284,140 |
| 2015 | $5,291 | $474,140 | $190,000 | $284,140 |
| 2014 | $5,137 | $461,330 | $180,000 | $281,330 |
Source: Public Records
Map
Nearby Homes
- 10508 Indigo Ln
- 10403 Ashcroft Way
- 10402 Hollyoak Place
- 10601 Fiesta Rd
- 5377 Laura Belle Ln
- 5219 Holden St
- 10388 Hampshire Green Ave
- 10412 Pearl St
- 10707 Paynes Church Dr
- 5207 Mornington Ct
- 5503 Fireside Ct
- 10306 Hampshire Green Ave
- 10434 Calumet Grove Dr
- 5267 Pumphrey Dr
- 13678 Water Crest Ct
- 0 Joshua Davis Ct
- 10449 Calumet Grove Dr
- 10116 Dundalk St
- 5408 Kennington Place
- 10343 Latney Rd
- 10431 Finchley Ct
- 10427 Finchley Ct
- 10514 Sideburn Ct
- 10516 Sideburn Ct
- 10425 Finchley Ct
- 10433 Finchley Ct
- 10428 Finchley Ct
- 10512 Sideburn Ct
- 10518 Sideburn Ct
- 5312 Kaywood Ct
- 10434 Finchley Ct
- 10510 Sideburn Ct
- 10432 Finchley Ct
- 10422 Finchley Ct
- 10423 Finchley Ct
- 10435 Finchley Ct
- 10520 Sideburn Ct
- 10508 Sideburn Ct
- 5310 Kaywood Ct
- 10409 Collingham Dr