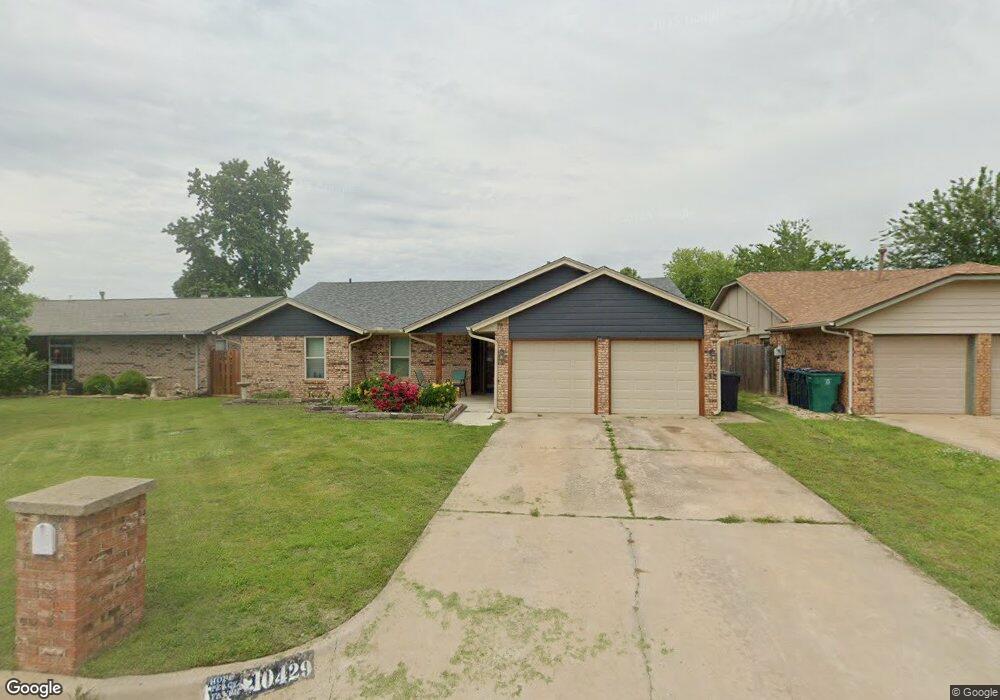
10429 Hollyhead Way Yukon, OK 73099
Westbury NeighborhoodEstimated Value: $196,643 - $212,000
3
Beds
2
Baths
1,360
Sq Ft
$151/Sq Ft
Est. Value
About This Home
This home is located at 10429 Hollyhead Way, Yukon, OK 73099 and is currently estimated at $205,161, approximately $150 per square foot. 10429 Hollyhead Way is a home located in Canadian County with nearby schools including Mustang Valley Elementary School, Canyon Ridge Intermediate School, and Mustang North Middle School.
Ownership History
Date
Name
Owned For
Owner Type
Purchase Details
Closed on
Jun 30, 2015
Sold by
Miller John W and Miller Kathy
Bought by
Vitale Shane C and Vitale Jennifer
Current Estimated Value
Home Financials for this Owner
Home Financials are based on the most recent Mortgage that was taken out on this home.
Original Mortgage
$125,000
Outstanding Balance
$97,604
Interest Rate
3.9%
Estimated Equity
$107,557
Purchase Details
Closed on
Apr 27, 2015
Sold by
Moore Michael Bryan
Bought by
Miller John W
Purchase Details
Closed on
Oct 28, 2004
Sold by
Weeks Patricia K
Home Financials for this Owner
Home Financials are based on the most recent Mortgage that was taken out on this home.
Original Mortgage
$96,678
Interest Rate
5.73%
Purchase Details
Closed on
Jan 28, 1999
Sold by
Randall Carey Joe
Purchase Details
Closed on
Oct 25, 1989
Purchase Details
Closed on
Mar 20, 1989
Create a Home Valuation Report for This Property
The Home Valuation Report is an in-depth analysis detailing your home's value as well as a comparison with similar homes in the area
Home Values in the Area
Average Home Value in this Area
Purchase History
| Date | Buyer | Sale Price | Title Company |
|---|---|---|---|
| Vitale Shane C | $125,000 | Fatco | |
| Miller John W | $81,500 | Fatco | |
| -- | $97,500 | -- | |
| -- | -- | -- | |
| -- | $42,000 | -- | |
| -- | -- | -- |
Source: Public Records
Mortgage History
| Date | Status | Borrower | Loan Amount |
|---|---|---|---|
| Open | Vitale Shane C | $125,000 | |
| Previous Owner | -- | $96,678 |
Source: Public Records
Tax History Compared to Growth
Tax History
| Year | Tax Paid | Tax Assessment Tax Assessment Total Assessment is a certain percentage of the fair market value that is determined by local assessors to be the total taxable value of land and additions on the property. | Land | Improvement |
|---|---|---|---|---|
| 2024 | $1,781 | $17,232 | $1,680 | $15,552 |
| 2023 | $1,781 | $16,730 | $1,680 | $15,050 |
| 2022 | $1,752 | $16,243 | $1,680 | $14,563 |
| 2021 | $1,691 | $15,770 | $1,680 | $14,090 |
| 2020 | $1,686 | $15,573 | $1,680 | $13,893 |
| 2019 | $1,632 | $15,119 | $1,680 | $13,439 |
| 2018 | $1,728 | $14,679 | $1,680 | $12,999 |
| 2017 | $1,722 | $14,818 | $1,680 | $13,138 |
| 2016 | $1,659 | $14,316 | $1,680 | $12,636 |
| 2015 | -- | $10,624 | $1,680 | $8,944 |
| 2014 | -- | $11,304 | $1,680 | $9,624 |
Source: Public Records
Map
Nearby Homes
- 10412 Dover Dr
- 10329 Kendal Ave
- 10428 Fairfax Ln
- 10340 Exter Ave
- 11805 Edi Ave
- 10321 Exter Ave
- 10210 Exter Ave
- 2138 Edinburg Dr
- 1813 Bonnycastle Ln
- 2122 Edinburg Dr
- 2105 Bonnycastle Ln
- 10509 Aberdeen Dr
- 10116 Thompson Ave
- 10001 Hollyhead Way
- 12613 NW 4th St
- 12616 NW 4th St
- 12608 NW 4th St
- 10037 Saint Helens Dr
- 1417 Mayer Dr
- 10041 Aberdeen Ln
- 10425 Hollyhead Way
- 10433 Hollyhead Way
- 10421 Hollyhead Way
- 10437 Hollyhead Way
- 10432 Dover Dr
- 10424 Dover Dr
- 10424 Hollyhead Way
- 10432 Hollyhead Way
- 10417 Hollyhead Way
- 10420 Dover Dr
- 10436 Dover Dr
- 10436 Hollyhead Way
- 10441 Hollyhead Way
- 10420 Hollyhead Way
- 10416 Dover Dr
- 10440 Dover Dr
- 10413 Hollyhead Way
- 10416 Hollyhead Way
- 10445 Hollyhead Way
- 10440 Hollyhead Way