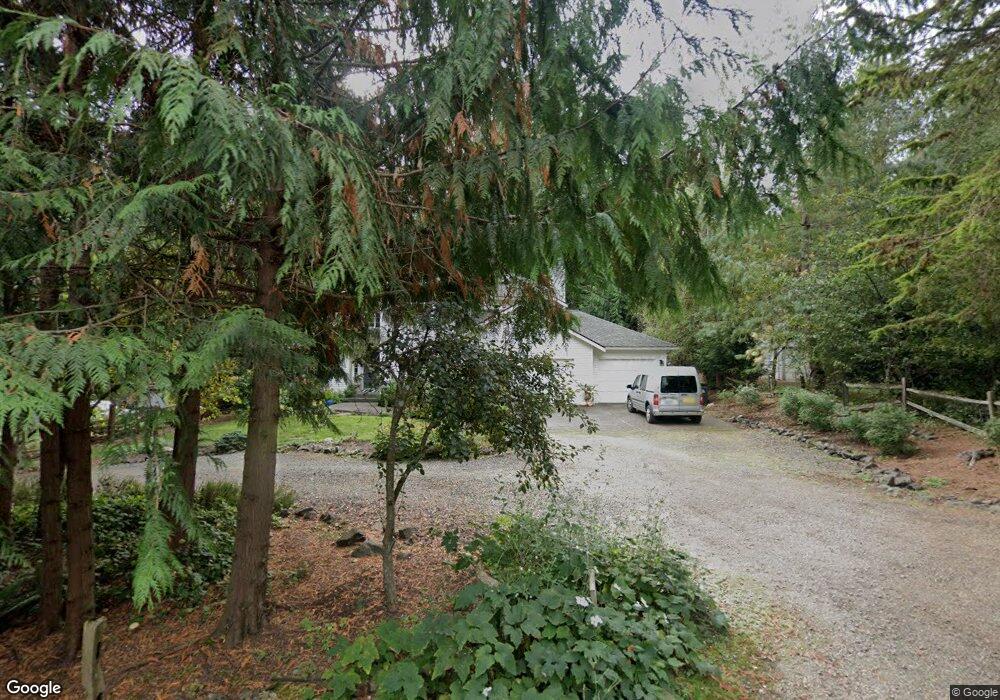
10429 NE Puget Bluff Ln Bainbridge Island, WA 98110
Estimated Value: $1,207,000 - $1,557,000
4
Beds
4
Baths
2,633
Sq Ft
$522/Sq Ft
Est. Value
About This Home
This home is located at 10429 NE Puget Bluff Ln, Bainbridge Island, WA 98110 and is currently estimated at $1,375,015, approximately $522 per square foot. 10429 NE Puget Bluff Ln is a home located in Kitsap County with nearby schools including Bainbridge High School and The Island School.
Ownership History
Date
Name
Owned For
Owner Type
Purchase Details
Closed on
Jun 22, 2007
Sold by
Gerlach Gregory R and Rougeau Gerlach Denice M
Bought by
Herring Philip and Mccall Kim E
Current Estimated Value
Home Financials for this Owner
Home Financials are based on the most recent Mortgage that was taken out on this home.
Original Mortgage
$75,100
Outstanding Balance
$46,596
Interest Rate
6.36%
Mortgage Type
Credit Line Revolving
Estimated Equity
$1,328,419
Purchase Details
Closed on
Aug 18, 2006
Sold by
Johnson Walter Lee and Johnson Pamela Doreen
Bought by
Gerlach Gregory R and Rougeau Gerlach Denice M
Purchase Details
Closed on
Oct 14, 1997
Sold by
Church Charles D
Bought by
Johnson Walter Lee and Johnson Pamela Doreen
Home Financials for this Owner
Home Financials are based on the most recent Mortgage that was taken out on this home.
Original Mortgage
$239,400
Interest Rate
8.75%
Create a Home Valuation Report for This Property
The Home Valuation Report is an in-depth analysis detailing your home's value as well as a comparison with similar homes in the area
Home Values in the Area
Average Home Value in this Area
Purchase History
| Date | Buyer | Sale Price | Title Company |
|---|---|---|---|
| Herring Philip | $601,280 | Transnation Title Ins Co | |
| Gerlach Gregory R | $555,280 | Pacific Nw Title | |
| Johnson Walter Lee | $266,000 | Pacific Nw Title |
Source: Public Records
Mortgage History
| Date | Status | Borrower | Loan Amount |
|---|---|---|---|
| Open | Herring Philip | $75,100 | |
| Open | Herring Philip | $417,000 | |
| Previous Owner | Johnson Walter Lee | $239,400 |
Source: Public Records
Tax History Compared to Growth
Tax History
| Year | Tax Paid | Tax Assessment Tax Assessment Total Assessment is a certain percentage of the fair market value that is determined by local assessors to be the total taxable value of land and additions on the property. | Land | Improvement |
|---|---|---|---|---|
| 2026 | $9,796 | $1,212,420 | $237,300 | $975,120 |
| 2025 | $9,796 | $1,212,420 | $237,300 | $975,120 |
| 2024 | $9,361 | $1,212,420 | $237,300 | $975,120 |
| 2023 | $9,770 | $1,212,420 | $237,300 | $975,120 |
| 2022 | $8,829 | $932,430 | $175,430 | $757,000 |
| 2021 | $8,587 | $864,660 | $162,560 | $702,100 |
| 2020 | $8,863 | $880,920 | $178,820 | $702,100 |
| 2019 | $7,912 | $800,630 | $162,090 | $638,540 |
| 2018 | $7,589 | $634,280 | $128,650 | $505,630 |
| 2017 | $6,619 | $634,280 | $128,650 | $505,630 |
| 2016 | $6,470 | $589,150 | $128,650 | $460,500 |
| 2015 | $5,723 | $530,540 | $128,650 | $401,890 |
| 2014 | -- | $480,300 | $128,650 | $351,650 |
| 2013 | -- | $480,300 | $128,650 | $351,650 |
Source: Public Records
Map
Nearby Homes
- 0 Ave N
- 14855 Phelps Rd NE
- 10240 NE Lafayette Ave
- 8484 NE County Park Rd
- 12079 Sunrise Dr NE
- 8552 NE Gordon Dr
- 8003 NE Hidden Cove Rd
- 12170 Viewcrest Place NE
- 0 NE Lovgreen Rd E Unit NWM2419912
- 7535 NE West Port Madison Rd
- 10211 NE Roberts Rd
- 0 NE Mountain View Rd
- 10871 Manitou Beach Dr NE
- 11000 Xx State Hwy 305 NE
- 0 NE Ocean (Lot A) Dr
- 0 NE Ocean (Lot B) Dr
- 16455 Agate Point Rd NE
- 0 Sunrise Dr NE
- 13392 Hidden Cove Ln NE
- 9820 NE Beach Crest Dr
- 10421 NE Puget Bluff Ln
- 14462 Sunrise Dr NE
- 10437 NE Puget Bluff Ln
- 10417 NE Puget Bluff Ln
- 14466 Sunrise Dr NE
- 14460 Sunrise Dr NE
- 14459 Sunrise Dr NE
- 10405 NE Puget Bluff Ln
- 14346 Sunrise Dr NE
- 10445 NE Puget Bluff Ln
- 14350 Sunrise Dr NE
- 14484 Sunrise Dr NE
- 14250 Sunrise Dr NE
- 14440 Sunrise Dr NE
- 14469 Sunrise Dr NE
- 10377 NE Woodhaven Ln
- 14336 Sunrise Dr NE
- 14341 Sunrise Dr NE
- 10850 NE Puget Bluff Ln
- 10448 NE Sunrise Bluff Ln