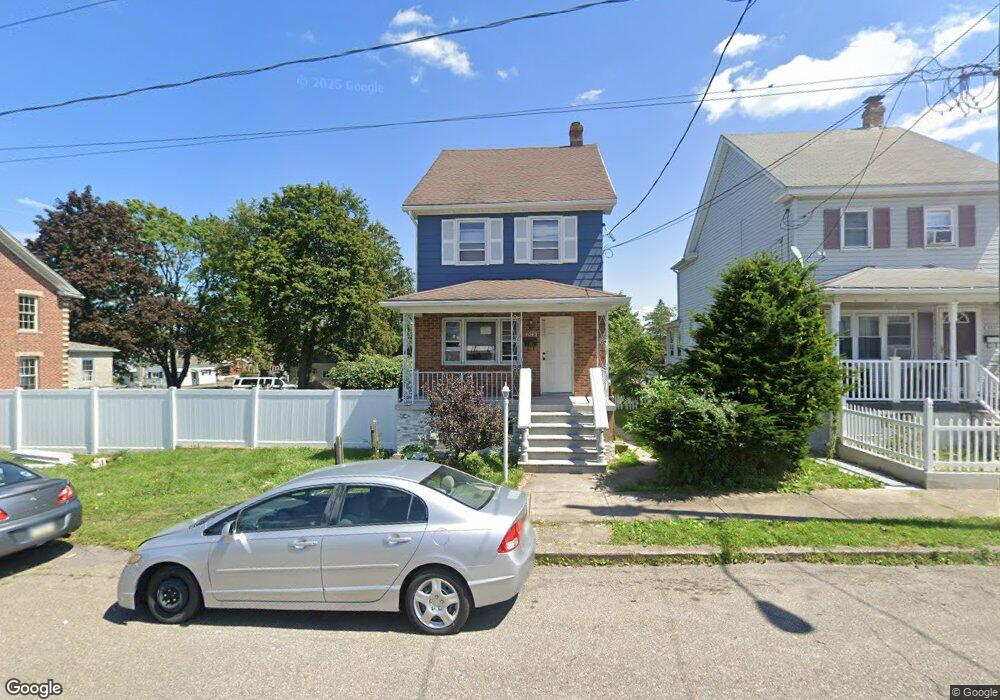
1043 Alter St Hazleton, PA 18202
Estimated Value: $192,351 - $242,000
3
Beds
2
Baths
1,450
Sq Ft
$146/Sq Ft
Est. Value
About This Home
This home is located at 1043 Alter St, Hazleton, PA 18202 and is currently estimated at $212,088, approximately $146 per square foot. 1043 Alter St is a home located in Luzerne County with nearby schools including Hazleton Area High School, Immanuel Christian School, and Bishop Hafey Junior/Senior High School.
Ownership History
Date
Name
Owned For
Owner Type
Purchase Details
Closed on
May 3, 2023
Sold by
Socha Bernard J
Bought by
7 Sons Llc
Current Estimated Value
Home Financials for this Owner
Home Financials are based on the most recent Mortgage that was taken out on this home.
Original Mortgage
$129,750
Outstanding Balance
$125,463
Interest Rate
6.42%
Mortgage Type
Construction
Estimated Equity
$86,625
Purchase Details
Closed on
Jul 1, 2010
Sold by
Socha Bernard J and Socha Gelgot Cynthia
Bought by
Socha Bernard J and Socha Gelgot Cynthia
Create a Home Valuation Report for This Property
The Home Valuation Report is an in-depth analysis detailing your home's value as well as a comparison with similar homes in the area
Home Values in the Area
Average Home Value in this Area
Purchase History
| Date | Buyer | Sale Price | Title Company |
|---|---|---|---|
| 7 Sons Llc | $173,000 | None Listed On Document | |
| Socha Bernard J | -- | None Available |
Source: Public Records
Mortgage History
| Date | Status | Borrower | Loan Amount |
|---|---|---|---|
| Open | 7 Sons Llc | $129,750 |
Source: Public Records
Tax History
| Year | Tax Paid | Tax Assessment Tax Assessment Total Assessment is a certain percentage of the fair market value that is determined by local assessors to be the total taxable value of land and additions on the property. | Land | Improvement |
|---|---|---|---|---|
| 2026 | $1,277 | $60,000 | $25,000 | $35,000 |
| 2025 | $1,221 | $60,000 | $25,000 | $35,000 |
| 2024 | $1,171 | $60,000 | $25,000 | $35,000 |
| 2023 | $1,148 | $60,000 | $25,000 | $35,000 |
| 2022 | $1,137 | $60,000 | $25,000 | $35,000 |
| 2021 | $1,102 | $60,000 | $25,000 | $35,000 |
| 2020 | $1,082 | $60,000 | $25,000 | $35,000 |
| 2019 | $1,037 | $60,000 | $25,000 | $35,000 |
| 2018 | $998 | $60,000 | $25,000 | $35,000 |
| 2017 | $976 | $60,000 | $25,000 | $35,000 |
| 2016 | -- | $98,100 | $32,500 | $65,600 |
| 2015 | $1,472 | $98,100 | $32,500 | $65,600 |
| 2014 | $1,472 | $98,100 | $32,500 | $65,600 |
Source: Public Records
Map
Nearby Homes
- 1087 Lafayette Ct
- 0 Church Unit PALU2002778
- 897 N Vine St
- 829 W 21st St
- 991 Seybert St
- 239 E 23rd St
- 397 W 30th St
- 911 Seybert St
- 756 Seybert St
- 403 W 7th St
- 14 W 4th St
- 60 E Jefferson Ave
- 127 W Diamond Ave
- 187 N Church St
- ER.126 W Aspen St
- 118 E Green St
- 1 W Diamond Ave
- 116 N Laurel St
- 360 W Spruce St
- TBD E Venisa Dr
Your Personal Tour Guide
Ask me questions while you tour the home.