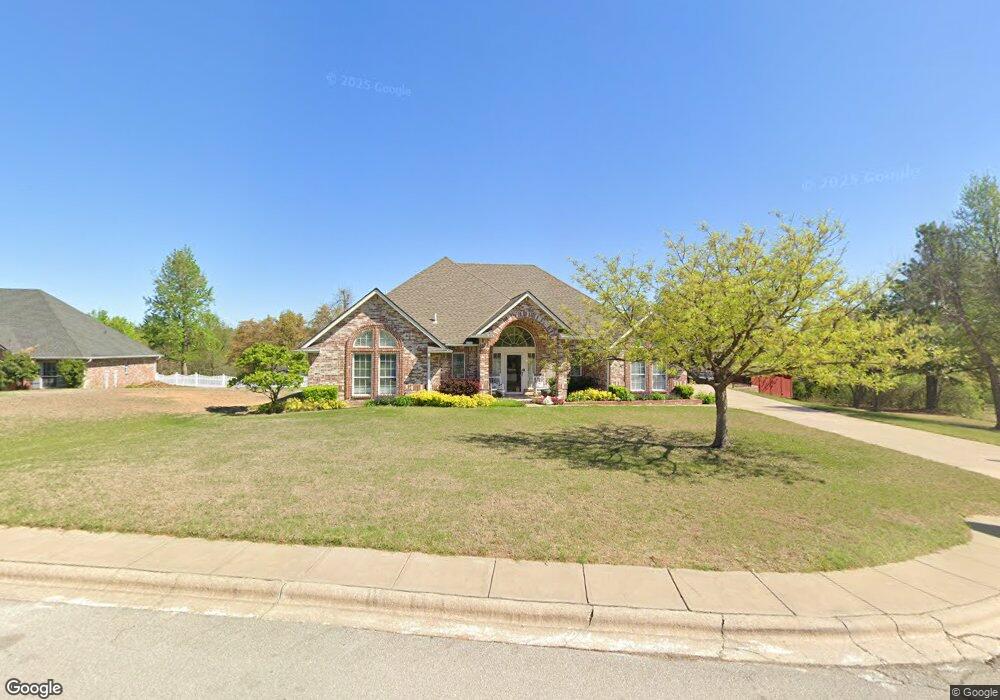
1043 Chaparral Nest Choctaw, OK 73020
Estimated Value: $337,000 - $384,000
3
Beds
2
Baths
2,263
Sq Ft
$157/Sq Ft
Est. Value
About This Home
This home is located at 1043 Chaparral Nest, Choctaw, OK 73020 and is currently estimated at $355,328, approximately $157 per square foot. 1043 Chaparral Nest is a home located in Oklahoma County with nearby schools including Indian Meridian Elementary School, James Griffith Intermediate Elementary School, and Choctaw Middle School.
Ownership History
Date
Name
Owned For
Owner Type
Purchase Details
Closed on
Oct 3, 2024
Sold by
Haynes Candace A and Haynes Mark S
Bought by
Mark And Candace Haynes Oath Trust and Haynes
Current Estimated Value
Purchase Details
Closed on
May 18, 2007
Sold by
Pierce Danna J and Pierce Robert
Bought by
Haynes Mark S and Haynes Candace A
Home Financials for this Owner
Home Financials are based on the most recent Mortgage that was taken out on this home.
Original Mortgage
$100,000
Interest Rate
6.17%
Mortgage Type
Purchase Money Mortgage
Purchase Details
Closed on
Oct 29, 2002
Sold by
Walker Lloyd J and Walker Lloyd Jonathan
Bought by
Walker Danna J and Walker Danna Joyce
Purchase Details
Closed on
Oct 4, 2002
Sold by
Walker Lloyd Jonathan
Bought by
Walker Danna Joyce
Create a Home Valuation Report for This Property
The Home Valuation Report is an in-depth analysis detailing your home's value as well as a comparison with similar homes in the area
Home Values in the Area
Average Home Value in this Area
Purchase History
| Date | Buyer | Sale Price | Title Company |
|---|---|---|---|
| Mark And Candace Haynes Oath Trust | -- | None Listed On Document | |
| Haynes Mark S | $215,000 | Stewart Escrow & Title Midwe | |
| Walker Danna J | -- | American Guaranty Title Co | |
| Walker Danna Joyce | -- | -- |
Source: Public Records
Mortgage History
| Date | Status | Borrower | Loan Amount |
|---|---|---|---|
| Previous Owner | Haynes Mark S | $100,000 |
Source: Public Records
Tax History Compared to Growth
Tax History
| Year | Tax Paid | Tax Assessment Tax Assessment Total Assessment is a certain percentage of the fair market value that is determined by local assessors to be the total taxable value of land and additions on the property. | Land | Improvement |
|---|---|---|---|---|
| 2024 | $3,061 | $27,731 | $7,966 | $19,765 |
| 2023 | $3,061 | $26,924 | $6,268 | $20,656 |
| 2022 | $2,920 | $26,140 | $7,121 | $19,019 |
| 2021 | $2,832 | $25,379 | $7,831 | $17,548 |
| 2020 | $2,762 | $24,640 | $7,925 | $16,715 |
| 2019 | $2,744 | $24,475 | $7,560 | $16,915 |
| 2018 | $2,720 | $24,200 | $0 | $0 |
| 2017 | $2,693 | $24,019 | $7,556 | $16,463 |
| 2016 | $2,626 | $23,319 | $7,560 | $15,759 |
| 2015 | $2,703 | $23,945 | $6,737 | $17,208 |
| 2014 | $2,647 | $23,247 | $6,695 | $16,552 |
Source: Public Records
Map
Nearby Homes
- 0 Henney Rd
- 00000 Henney Rd
- 1371 Whippoorwill Nest
- 571 Misty Morning Dr
- 13855 SE 15th St
- 13723 Ravenswood Dr
- 13868 E Reno Ave
- 0 Willow Dr Unit 1178441
- 14404 Ironside Dr
- 1668 E Circle Dr
- 1031 Hidden Valley Ln
- 14248 MacKlay Ct
- 1608 Morning Mist
- 501 Willow Dr
- 1615 Morning Mist
- 0 SE 15th St
- 1713 Rain Tree Ln
- 13276 Sawtooth Oak Rd
- 13195 Red Oak Dr
- 13275 Sawtooth Oak Rd
- 1047 Chaparral Nest
- 1050 Chaparral Dr
- 1079 Chaparral Dr
- 1064 Chaparral Dr
- 1049 Chaparral Nest
- 1098 Chaparral Dr
- 1071 Chaparral Nest
- 1123 Chaparral Dr
- 1038 Chaparral Dr
- 1081 Chaparral Nest
- 1090 Chaparral Nest
- 14275 Whippoorwill Vista
- 14268 Whippoorwill Vista
- 14285 Whippoorwill Vista
- 1179 Chaparral Dr
- 14241 Whippoorwill Vista
- 1086 Chaparral Nest
- 14055 Hummingbird Dr
- 14295 Whippoorwill Vista
- 14175 Hummingbird Dr