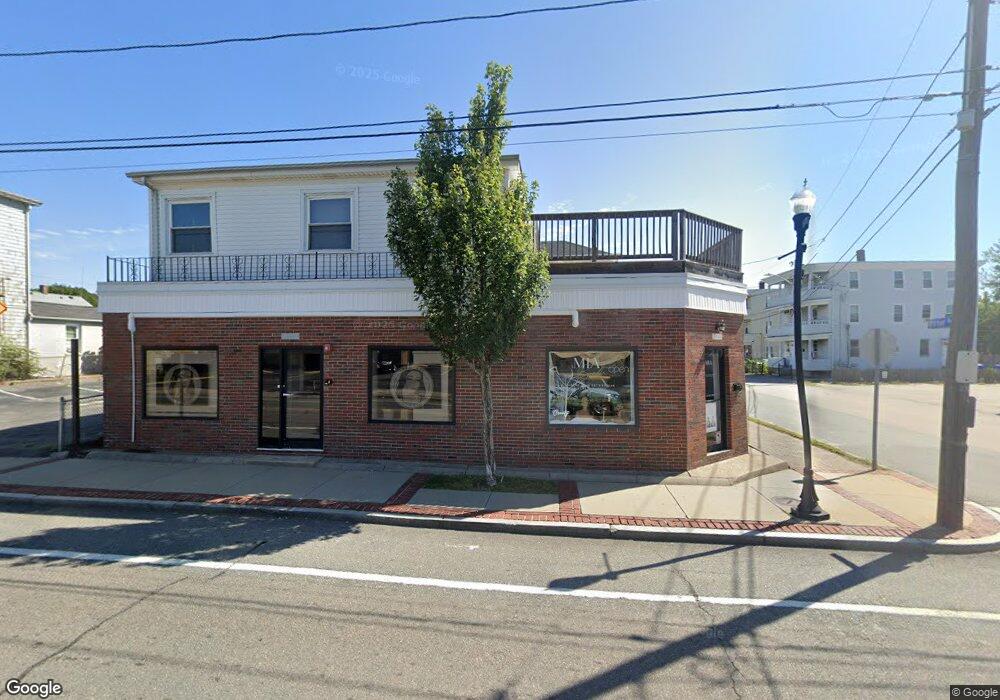
1043 Charles St North Providence, RI 02904
Marieville NeighborhoodEstimated Value: $376,299
3
Beds
3
Baths
5,000
Sq Ft
$75/Sq Ft
Est. Value
About This Home
This home is located at 1043 Charles St, North Providence, RI 02904 and is currently estimated at $376,299, approximately $75 per square foot. 1043 Charles St is a home located in Providence County with nearby schools including North Providence High School, The San Miguel School, and Bishop Keough Regional High School.
Ownership History
Date
Name
Owned For
Owner Type
Purchase Details
Closed on
Nov 1, 2019
Sold by
Kyltiff Invests and Kyltiff Consultng
Bought by
Calcagni Holdings Llc
Current Estimated Value
Purchase Details
Closed on
Oct 27, 2017
Sold by
13 Investments Llc
Bought by
Kyltiff Investments & Co
Purchase Details
Closed on
Sep 11, 2012
Sold by
1043-1045 Charles St L
Bought by
Dc Realty Inc
Home Financials for this Owner
Home Financials are based on the most recent Mortgage that was taken out on this home.
Original Mortgage
$1,900,000
Interest Rate
3.52%
Mortgage Type
Commercial
Purchase Details
Closed on
Apr 5, 2011
Sold by
Campellone Edith Est and Campellone
Bought by
Campellone Peter J
Home Financials for this Owner
Home Financials are based on the most recent Mortgage that was taken out on this home.
Original Mortgage
$120,000
Interest Rate
5.04%
Mortgage Type
Commercial
Create a Home Valuation Report for This Property
The Home Valuation Report is an in-depth analysis detailing your home's value as well as a comparison with similar homes in the area
Home Values in the Area
Average Home Value in this Area
Purchase History
| Date | Buyer | Sale Price | Title Company |
|---|---|---|---|
| Calcagni Holdings Llc | $218,100 | -- | |
| Calcagni Holdings Llc | $218,100 | -- | |
| Kyltiff Investments & Co | -- | -- | |
| Kyltiff Investments & Co | -- | -- | |
| Dc Realty Inc | $140,000 | -- | |
| Dc Realty Inc | $45,000 | -- | |
| Dc Realty Inc | $140,000 | -- | |
| Campellone Peter J | -- | -- | |
| Campellone Peter J | -- | -- |
Source: Public Records
Mortgage History
| Date | Status | Borrower | Loan Amount |
|---|---|---|---|
| Previous Owner | Campellone Peter J | $1,900,000 | |
| Previous Owner | Campellone Peter J | $0 | |
| Previous Owner | Campellone Peter J | $120,000 |
Source: Public Records
Tax History Compared to Growth
Tax History
| Year | Tax Paid | Tax Assessment Tax Assessment Total Assessment is a certain percentage of the fair market value that is determined by local assessors to be the total taxable value of land and additions on the property. | Land | Improvement |
|---|---|---|---|---|
| 2025 | $5,807 | $330,300 | $98,600 | $231,700 |
| 2024 | -- | $330,300 | $98,600 | $231,700 |
| 2023 | $0 | $330,300 | $98,600 | $231,700 |
| 2022 | $0 | $268,500 | $67,900 | $200,600 |
| 2021 | $0 | $250,300 | $67,900 | $182,400 |
| 2020 | $0 | $250,300 | $67,900 | $182,400 |
| 2017 | $0 | $237,400 | $66,200 | $171,200 |
| 2016 | -- | $256,300 | $64,200 | $192,100 |
| 2015 | -- | $256,300 | $64,200 | $192,100 |
| 2014 | -- | $256,300 | $64,200 | $192,100 |
Source: Public Records
Map
Nearby Homes
- 5 Morrill Ln Unit C
- 9 Morrill Ln Unit 1
- 1 Oliver St
- 1111 Charles St
- 48 Cleveland St
- 15 Bassett St
- 37 Hurdis St
- 27 Gillen Ave Unit 205A
- 12 Atwood Ave
- 1190 Charles St Unit 20
- 1190 Charles St Unit 12
- 1190 Charles St Unit 21
- 10 Windmill St
- 27 Stedman Ave
- 21 Urban Ave
- 880 Charles St
- 192 Terrace Ave
- 0 Piave St
- 3 Victor Emanuel Ave
- 862 Charles St
- 1045 Charles St
- 1048 Charles St
- 1049 Charles St
- 1046 Charles St
- 1044 Charles St
- 1052 Charles St
- 1038 Charles St
- 160 Vincent Ave
- 160 Urban Ave Unit 192
- 1058 Charles St
- 175 Urban Ave
- 156 Urban Ave
- 156 Urban Ave Unit 1
- 156 Urban Ave Unit 3
- 158 Vincent Ave
- 180 Vincent Ave
- 182 Urban Ave
- 182 Vincent Ave
- 1029 Charles St Unit 1029
- 1029 Charles St