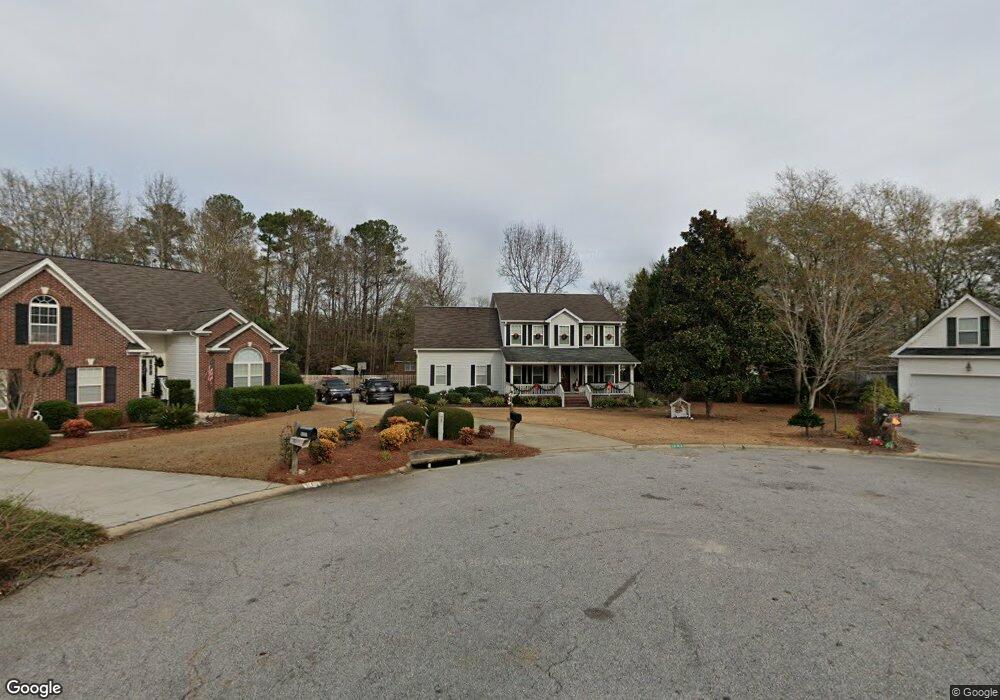
1043 Crestwater Ct West Columbia, SC 29169
Estimated Value: $373,678 - $407,000
5
Beds
3
Baths
2,321
Sq Ft
$168/Sq Ft
Est. Value
About This Home
This home is located at 1043 Crestwater Ct, West Columbia, SC 29169 and is currently estimated at $389,670, approximately $167 per square foot. 1043 Crestwater Ct is a home located in Lexington County with nearby schools including Saluda River Academy For The Arts, Northside Middle, and Brookland-Cayce High School.
Ownership History
Date
Name
Owned For
Owner Type
Purchase Details
Closed on
Jul 22, 2022
Sold by
Koenig Thomas L
Bought by
Wakeman David M and Wakeman Rebeca F
Current Estimated Value
Home Financials for this Owner
Home Financials are based on the most recent Mortgage that was taken out on this home.
Original Mortgage
$309,294
Outstanding Balance
$295,940
Interest Rate
5.78%
Mortgage Type
FHA
Estimated Equity
$93,730
Purchase Details
Closed on
Jan 26, 2018
Sold by
Naxfaze Properties Llc
Bought by
Koenig Thomas L and Koenig Christine M
Home Financials for this Owner
Home Financials are based on the most recent Mortgage that was taken out on this home.
Original Mortgage
$188,275
Interest Rate
3.93%
Mortgage Type
New Conventional
Purchase Details
Closed on
Jun 8, 2017
Sold by
Bank Of New York Mellon
Bought by
Nexfaze Properties Llc
Purchase Details
Closed on
Dec 14, 2004
Sold by
Tate Robert M
Bought by
Pence Heather W
Create a Home Valuation Report for This Property
The Home Valuation Report is an in-depth analysis detailing your home's value as well as a comparison with similar homes in the area
Home Values in the Area
Average Home Value in this Area
Purchase History
| Date | Buyer | Sale Price | Title Company |
|---|---|---|---|
| Wakeman David M | $315,000 | None Listed On Document | |
| Koenig Thomas L | $221,500 | None Available | |
| Nexfaze Properties Llc | $147,000 | None Available | |
| Pence Heather W | -- | -- |
Source: Public Records
Mortgage History
| Date | Status | Borrower | Loan Amount |
|---|---|---|---|
| Open | Wakeman David M | $309,294 | |
| Previous Owner | Koenig Thomas L | $188,275 |
Source: Public Records
Tax History Compared to Growth
Tax History
| Year | Tax Paid | Tax Assessment Tax Assessment Total Assessment is a certain percentage of the fair market value that is determined by local assessors to be the total taxable value of land and additions on the property. | Land | Improvement |
|---|---|---|---|---|
| 2024 | $2,360 | $12,600 | $1,600 | $11,000 |
| 2023 | $2,408 | $8,918 | $1,600 | $7,318 |
| 2022 | $1,721 | $8,918 | $1,600 | $7,318 |
| 2020 | $1,653 | $8,918 | $1,600 | $7,318 |
| 2019 | $1,675 | $8,860 | $1,600 | $7,260 |
| 2018 | $4,113 | $11,579 | $2,100 | $9,479 |
| 2017 | $1,520 | $8,292 | $1,400 | $6,892 |
| 2016 | $1,563 | $8,292 | $1,400 | $6,892 |
| 2014 | $1,189 | $8,291 | $920 | $7,371 |
| 2013 | -- | $8,290 | $920 | $7,370 |
Source: Public Records
Map
Nearby Homes
- 1500 Redwood Dr
- 1509 Goldfinch Ln
- 1540 Sewanee Dr
- 292 Marabou Cir
- 1711 Holly Hill Dr
- 0 Sunset Blvd Unit 553428
- 100 Double Branch Ct
- 0 Terrace View Dr
- 318 Skipperling Ln
- 1715 Gilvie Ave
- 929-931 Central Dr
- 500 Finnegan Ln
- 55 Holly Ridge Ln
- 529 Finnegan Ln
- 175 Hulon Greene Place Unit 3
- 1100 Seminole Dr
- 7 Janice Fe Trail
- 13 Janice Fe Trail
- 21 Janice Fe Trail
- 906 Brantley St
- 1417 Cardinal Dr
- 1040 Crestwater Ct
- 1413 Cardinal Dr
- 1033 Crestwater Ct
- 1036 Crestwater Ct
- 1409 Cardinal Dr
- 1029 Crestwater Ct
- 1034 Riverstone Ct
- 1037 Riverstone Ct
- 1421 Cardinal Dr
- 1032 Crestwater Ct
- 1708 Saluda River Dr
- 1025 Crestwater Ct
- 1704 Saluda River Dr
- 1028 Crestwater Ct
- 1416 Cardinal Dr
- 1800 Saluda River Dr
- 1420 Cardinal Dr
- 1030 Riverstone Ct
- 1427 Cardinal Dr