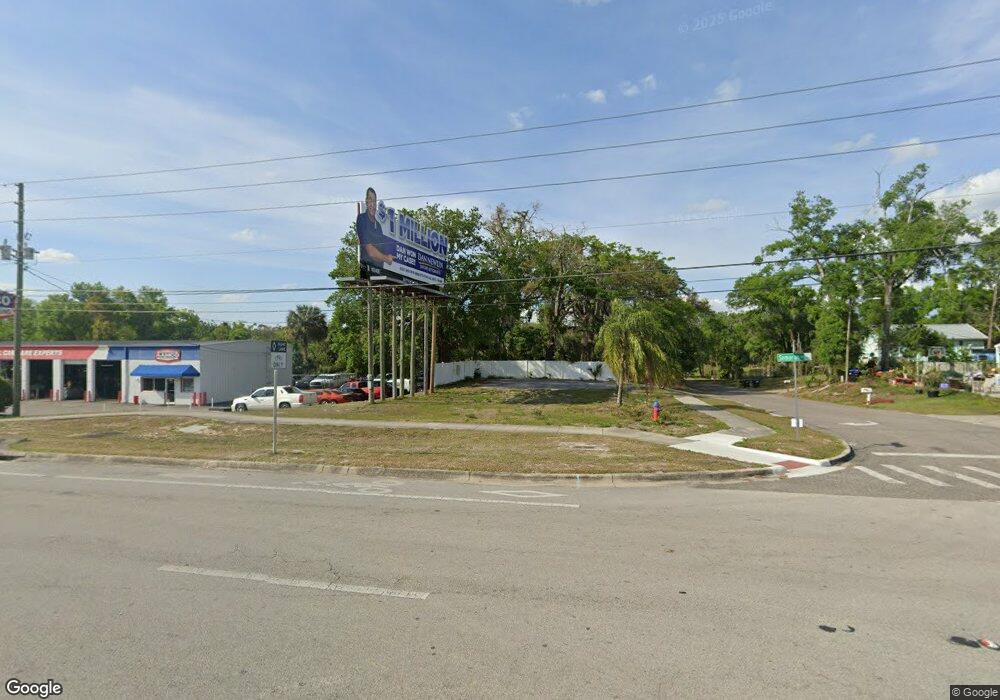
1043 E Semoran Blvd Apopka, FL 32703
Estimated Value: $224,000
Studio
--
Bath
824
Sq Ft
$272/Sq Ft
Est. Value
About This Home
This home is located at 1043 E Semoran Blvd, Apopka, FL 32703 and is currently estimated at $224,000, approximately $271 per square foot. 1043 E Semoran Blvd is a home located in Orange County with nearby schools including Lovell Elementary School, Apopka Middle School, and Apopka High School.
Ownership History
Date
Name
Owned For
Owner Type
Purchase Details
Closed on
Aug 11, 2015
Sold by
Seacost Bank
Bought by
Phillips Laurence George
Current Estimated Value
Home Financials for this Owner
Home Financials are based on the most recent Mortgage that was taken out on this home.
Original Mortgage
$75,000
Outstanding Balance
$59,147
Interest Rate
4.11%
Mortgage Type
Commercial
Estimated Equity
$164,853
Purchase Details
Closed on
Sep 12, 2013
Sold by
Debitetto Jeffrey M and Debitetto Tess Haubner
Bought by
Bankfirst
Purchase Details
Closed on
Feb 25, 2005
Sold by
Welch Margaret
Bought by
Debitetto Jeffrey M and Debitetto Tess Haubner
Home Financials for this Owner
Home Financials are based on the most recent Mortgage that was taken out on this home.
Original Mortgage
$78,000
Interest Rate
5.61%
Mortgage Type
Commercial
Create a Home Valuation Report for This Property
The Home Valuation Report is an in-depth analysis detailing your home's value as well as a comparison with similar homes in the area
Home Values in the Area
Average Home Value in this Area
Purchase History
| Date | Buyer | Sale Price | Title Company |
|---|---|---|---|
| Phillips Laurence George | $145,000 | Supreme Florida Title Inc | |
| Bankfirst | $135,100 | None Available | |
| Debitetto Jeffrey M | $97,500 | -- |
Source: Public Records
Mortgage History
| Date | Status | Borrower | Loan Amount |
|---|---|---|---|
| Open | Phillips Laurence George | $75,000 | |
| Previous Owner | Debitetto Jeffrey M | $78,000 |
Source: Public Records
Tax History
| Year | Tax Paid | Tax Assessment Tax Assessment Total Assessment is a certain percentage of the fair market value that is determined by local assessors to be the total taxable value of land and additions on the property. | Land | Improvement |
|---|---|---|---|---|
| 2025 | $2,154 | $133,904 | $131,104 | $2,800 |
| 2024 | $1,961 | $127,661 | $124,861 | $2,800 |
| 2023 | $1,961 | $126,864 | $124,864 | $2,000 |
| 2022 | $1,840 | $118,601 | $116,601 | $2,000 |
| 2021 | $1,706 | $107,899 | $105,899 | $2,000 |
| 2020 | $1,651 | $107,899 | $105,899 | $2,000 |
| 2019 | $1,731 | $106,794 | $104,794 | $2,000 |
| 2018 | $2,228 | $135,741 | $102,177 | $33,564 |
| 2017 | $2,232 | $134,453 | $92,910 | $41,543 |
| 2016 | $2,251 | $132,754 | $91,514 | $41,240 |
| 2015 | $2,311 | $133,008 | $91,514 | $41,494 |
| 2014 | $2,325 | $131,768 | $90,061 | $41,707 |
Source: Public Records
Map
Nearby Homes
- 378 Thompson Rd
- 0 Sand Ave Unit MFRS5138566
- 0 Sand Ave Unit MFRO6346601
- 1005 Love Ln Unit 25
- 642 S Orange Blossom Trail
- 1011 Love Ln Unit 31
- 1003 E 10th St
- 991 E 10th St
- 494 Thompson Village Ave
- 462 Thompson Village Ave
- 454 Thompson Village Ave
- 450 Thompson Village Ave
- 475 Thompson Village Ave
- 1402 Rolling Green Dr
- 1120 Sheeler Ave
- 1372 Everglades Cir Unit 64
- 00 S Christiana Ave
- 103 N Cervidae Dr
- 1169 Bellwood Cir
- 1240 E Votaw Rd
- 1103 E Semoran Blvd
- 323 Illinois Ave
- 301 Illinois Ave
- 1102 E Semoran Blvd Unit 1120
- 1024 E Semoran Blvd
- 225 Illinois Ave
- 1016 E Semoran Blvd
- 316 S Thompson Rd
- 310 S Thompson Rd
- 274 Thompson Rd
- 232 S Thompson Rd
- 250 Illinois Ave
- 226 S Thompson Rd
- 416 Blue Bird St
- 977 Monroe Ct
- 145 Illinois Ave
- 435 Blue Bird St
- 222 S Thompson Rd
- 309 S Thompson Rd
- 1220 E Semoran Blvd
Your Personal Tour Guide
Ask me questions while you tour the home.