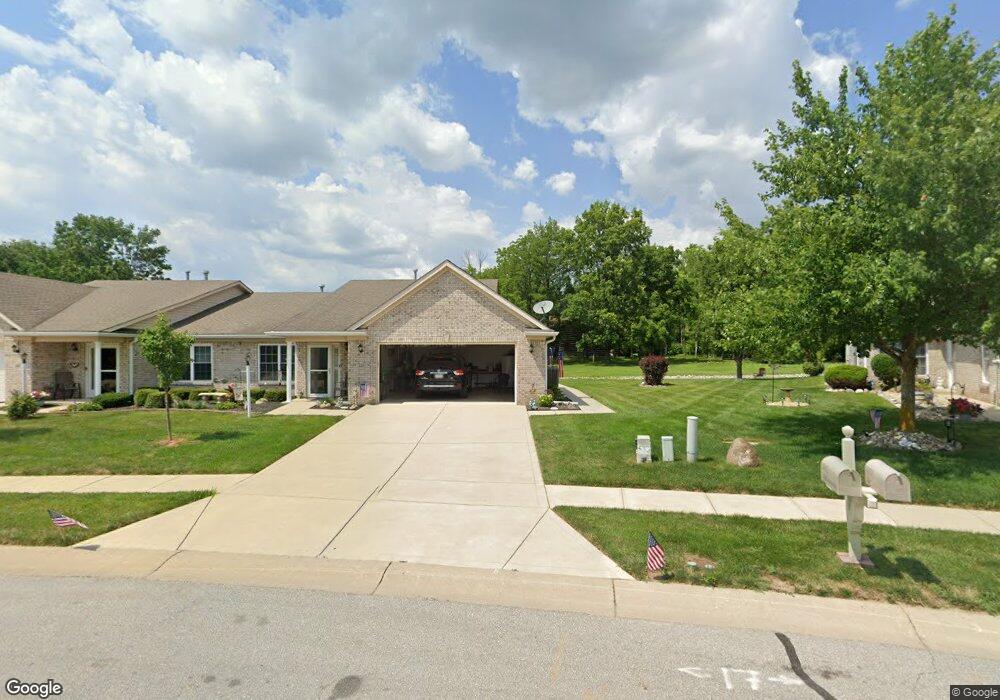
1043 Hilltop Commons Blvd Whiteland, IN 46184
Estimated Value: $258,000 - $277,060
2
Beds
2
Baths
1,601
Sq Ft
$167/Sq Ft
Est. Value
About This Home
This home is located at 1043 Hilltop Commons Blvd, Whiteland, IN 46184 and is currently estimated at $267,515, approximately $167 per square foot. 1043 Hilltop Commons Blvd is a home located in Johnson County with nearby schools including Break-O-Day Elementary School, Clark-Pleasant Middle School, and Whiteland Community High School.
Ownership History
Date
Name
Owned For
Owner Type
Purchase Details
Closed on
Oct 3, 2023
Sold by
Long Pamela A and Annis Peggy J
Bought by
Bailey Joseph P and Bailey Judy L
Current Estimated Value
Home Financials for this Owner
Home Financials are based on the most recent Mortgage that was taken out on this home.
Original Mortgage
$165,000
Outstanding Balance
$161,642
Interest Rate
7.18%
Mortgage Type
New Conventional
Estimated Equity
$105,873
Purchase Details
Closed on
Jul 22, 2015
Sold by
Benford Stephen A
Bought by
Pruitt Phyllis
Purchase Details
Closed on
Jul 20, 2010
Sold by
Benford Maxine C
Bought by
Benford Maxine C and Revocable Trust Of Maxine C Benford
Purchase Details
Closed on
Jan 6, 2006
Sold by
David Brizendive Inc
Bought by
Benford Daniel P and Benford Maxine C
Create a Home Valuation Report for This Property
The Home Valuation Report is an in-depth analysis detailing your home's value as well as a comparison with similar homes in the area
Home Values in the Area
Average Home Value in this Area
Purchase History
| Date | Buyer | Sale Price | Title Company |
|---|---|---|---|
| Bailey Joseph P | -- | Security Title | |
| Pruitt Phyllis | -- | None Available | |
| Benford Maxine C | -- | None Available | |
| Benford Daniel P | -- | None Available |
Source: Public Records
Mortgage History
| Date | Status | Borrower | Loan Amount |
|---|---|---|---|
| Open | Bailey Joseph P | $165,000 |
Source: Public Records
Tax History Compared to Growth
Tax History
| Year | Tax Paid | Tax Assessment Tax Assessment Total Assessment is a certain percentage of the fair market value that is determined by local assessors to be the total taxable value of land and additions on the property. | Land | Improvement |
|---|---|---|---|---|
| 2025 | $2,176 | $262,300 | $45,000 | $217,300 |
| 2024 | $2,176 | $211,300 | $45,000 | $166,300 |
| 2023 | $2,111 | $203,100 | $45,000 | $158,100 |
| 2022 | $1,855 | $178,800 | $34,100 | $144,700 |
| 2021 | $1,642 | $157,900 | $31,000 | $126,900 |
| 2020 | $1,523 | $145,800 | $21,000 | $124,800 |
| 2019 | $1,539 | $147,300 | $21,000 | $126,300 |
| 2018 | $1,467 | $143,600 | $22,000 | $121,600 |
| 2017 | $1,444 | $143,400 | $22,000 | $121,400 |
| 2016 | $1,342 | $134,900 | $22,000 | $112,900 |
| 2014 | $2,994 | $148,300 | $23,000 | $125,300 |
| 2013 | $2,994 | $149,700 | $23,000 | $126,700 |
Source: Public Records
Map
Nearby Homes
- 106 Tracy Ridge Blvd
- 1119 Chateaugay Ct
- 190 Tracy Ridge Blvd
- 256 Bittersweet Dr
- 821 Princeton Dr
- 12 Rypma Row
- 731 W 600 N
- 250 Southlane Dr
- 53 Oakden Ct
- 57 Oakden Ct
- 6540 N Us Highway 31
- 840 Sweetbriar Ave
- 647 Bluestem Cir
- 0 E 700 N Unit MBR22036500
- 239 Shelton Place
- 230 Parkview Dr
- 539 Delbrook Dr
- Liberty Plan at Crossroads at Southport
- 7331 Deerberg Dr
- Jefferson Plan at Crossroads at Southport
- 1047 Hilltop Commons Blvd
- 1039 Hilltop Commons Blvd
- 1051 Hilltop Commons Blvd
- 1035 Hilltop Commons Blvd
- 1055 Hilltop Commons Blvd
- 1032 Hilltop Commons Blvd
- 1059 Hilltop Commons Blvd
- 1052 Hilltop Commons Blvd
- 1031 Hilltop Commons Blvd
- 1027 Hilltop Commons Blvd
- 1063 Hilltop Commons Blvd
- 1060 Hilltop Commons Blvd
- 1023 Hilltop Commons Blvd
- 124 Arabian Ct
- 116 Arabian Ct
- 1067 Hilltop Commons Blvd
- 140 Arabian Ct
- 1019 Hilltop Commons Blvd
- 1064 Hilltop Commons Blvd
- 148 Arabian Ct