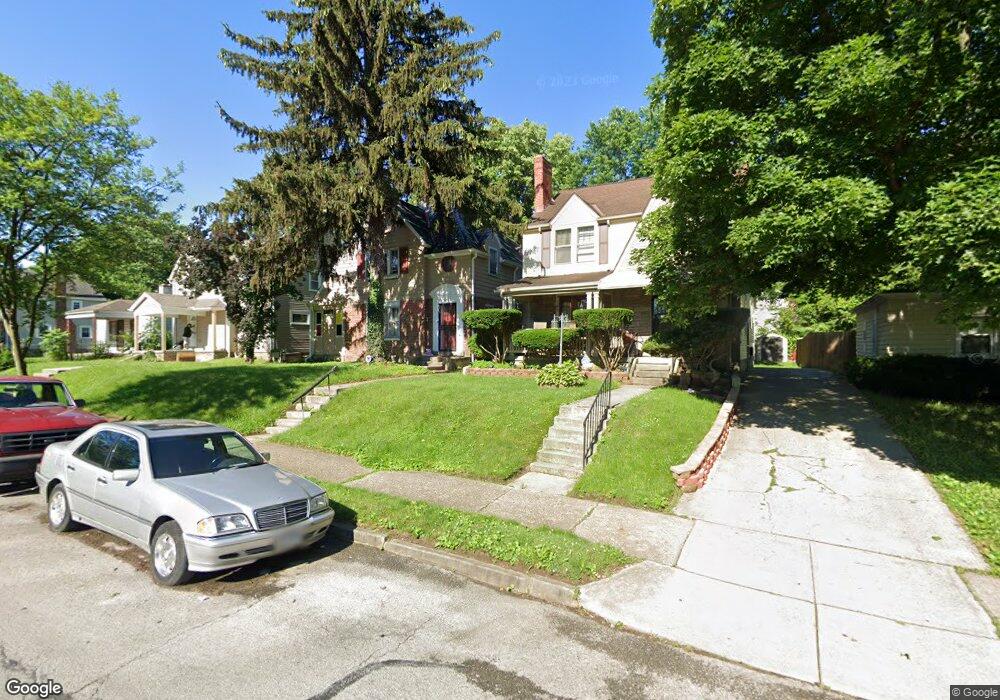
1043 Kelton Ave Columbus, OH 43206
Driving Park NeighborhoodEstimated Value: $183,000 - $226,483
3
Beds
1
Bath
1,594
Sq Ft
$130/Sq Ft
Est. Value
About This Home
This home is located at 1043 Kelton Ave, Columbus, OH 43206 and is currently estimated at $206,871, approximately $129 per square foot. 1043 Kelton Ave is a home located in Franklin County with nearby schools including Fairwood Alternative Elementary School, South High School, and Capital Collegiate Preparatory Academy.
Ownership History
Date
Name
Owned For
Owner Type
Purchase Details
Closed on
Dec 8, 2023
Sold by
Stewart Lisa E
Bought by
Stewart Family Trust and Stewart
Current Estimated Value
Purchase Details
Closed on
Jul 24, 2018
Sold by
Monggomery James C and Stewart Lisa E
Bought by
Stewart Lisa E
Purchase Details
Closed on
Aug 17, 2011
Sold by
Montgometry Wanda J and Montgometry James C
Bought by
Montgometry James C
Purchase Details
Closed on
Jan 4, 1998
Sold by
Kirk Wanda J and Montgomery Wanda J
Bought by
Montgomery James C and Montgomery Wanda J
Purchase Details
Closed on
Jun 6, 1997
Sold by
Harvey Phyllis A
Bought by
Kirk Wanda J
Home Financials for this Owner
Home Financials are based on the most recent Mortgage that was taken out on this home.
Original Mortgage
$40,600
Interest Rate
8.17%
Create a Home Valuation Report for This Property
The Home Valuation Report is an in-depth analysis detailing your home's value as well as a comparison with similar homes in the area
Home Values in the Area
Average Home Value in this Area
Purchase History
| Date | Buyer | Sale Price | Title Company |
|---|---|---|---|
| Stewart Family Trust | -- | None Listed On Document | |
| Stewart Lisa E | -- | None Available | |
| Montgometry James C | -- | None Available | |
| Montgomery James C | -- | Celtic Title Agency Inc | |
| Kirk Wanda J | $58,000 | Celtic Title Agency Inc |
Source: Public Records
Mortgage History
| Date | Status | Borrower | Loan Amount |
|---|---|---|---|
| Previous Owner | Kirk Wanda J | $40,600 |
Source: Public Records
Tax History Compared to Growth
Tax History
| Year | Tax Paid | Tax Assessment Tax Assessment Total Assessment is a certain percentage of the fair market value that is determined by local assessors to be the total taxable value of land and additions on the property. | Land | Improvement |
|---|---|---|---|---|
| 2024 | $3,046 | $66,470 | $11,590 | $54,880 |
| 2023 | $3,008 | $66,465 | $11,585 | $54,880 |
| 2022 | $1,395 | $26,250 | $2,590 | $23,660 |
| 2021 | $1,398 | $26,250 | $2,590 | $23,660 |
| 2020 | $1,400 | $26,250 | $2,590 | $23,660 |
| 2019 | $1,441 | $21,670 | $2,170 | $19,500 |
| 2018 | $673 | $21,670 | $2,170 | $19,500 |
| 2017 | $1,322 | $21,670 | $2,170 | $19,500 |
| 2016 | $1,296 | $19,080 | $3,360 | $15,720 |
| 2015 | $590 | $19,080 | $3,360 | $15,720 |
| 2014 | $1,183 | $19,080 | $3,360 | $15,720 |
| 2013 | $686 | $22,435 | $3,955 | $18,480 |
Source: Public Records
Map
Nearby Homes
- 1337 E Kossuth St Unit 1339
- 991 Lilley Ave
- 1021-1023 Miller Ave
- 980 Miller Ave
- 959 Kelton Ave
- 954 Miller Ave
- 993 Miller Ave Unit 995
- 1095 Berkeley Rd
- 961 Lilley Ave
- 928 Miller Ave
- 1417 E Whittier St
- 910 Ellsworth Ave
- 1025 Lockbourne Rd Unit 27
- 1184-1186 Lilley Ave
- 901 Miller Ave
- 889 Kelton Ave
- 1485 E Whittier St
- 1005 Studer Ave
- 1345 E Livingston Ave Unit 1347
- 1390 E Livingston Ave
- 1039 Kelton Ave
- 1049 Kelton Ave
- 1053 Kelton Ave
- 1031 Kelton Ave
- 1350 E Kossuth St
- 1346 E Kossuth St
- 1032 Ellsworth Ave Unit 34
- 1025 Kelton Ave
- 1065 Kelton Ave
- 1024 Ellsworth Ave Unit 26
- 1348 E Kossuth St
- 1046 Kelton Ave
- 1050 Kelton Ave
- 1340 E Kossuth St
- 1040 Kelton Ave
- 1026 Ellsworth Ave Unit 6
- 1056 Kelton Ave
- 1036 Kelton Ave
- 1018 Ellsworth Ave Unit 20
- 1018 Ellsworth Ave Unit 1