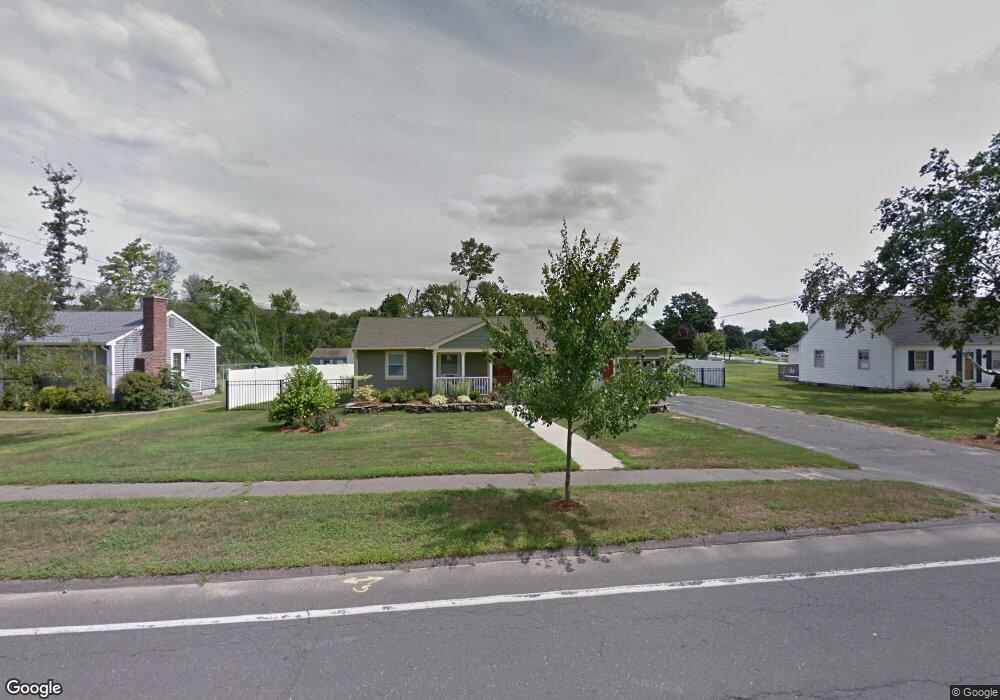
1043 Tinkham Rd Wilbraham, MA 01095
Estimated Value: $387,666 - $472,000
3
Beds
1
Bath
1,080
Sq Ft
$384/Sq Ft
Est. Value
About This Home
This home is located at 1043 Tinkham Rd, Wilbraham, MA 01095 and is currently estimated at $414,417, approximately $383 per square foot. 1043 Tinkham Rd is a home located in Hampden County with nearby schools including Minnechaug Regional High School, Pioneer Valley Montessori School, and Wilbraham & Monson Academy.
Ownership History
Date
Name
Owned For
Owner Type
Purchase Details
Closed on
Dec 10, 2024
Sold by
Silver Bradley C and Silver Amelia L
Bought by
Bradley C Silva T C and Bradley Silver
Current Estimated Value
Purchase Details
Closed on
Sep 30, 2009
Sold by
Horne Kevin J and Horne Cathy T
Bought by
Silver Bradley C and Silver Amelia L
Home Financials for this Owner
Home Financials are based on the most recent Mortgage that was taken out on this home.
Original Mortgage
$196,000
Interest Rate
5.12%
Mortgage Type
Purchase Money Mortgage
Purchase Details
Closed on
May 31, 2000
Sold by
Purucker Leonne M
Bought by
Carlos Cathy T and Horne Kevin J
Purchase Details
Closed on
Aug 25, 1998
Sold by
Ferraro Peter C and Romeo-Ferraro Teresa
Bought by
Purucker Brent A and Purucker Leonne M
Purchase Details
Closed on
Nov 29, 1989
Sold by
Pell Luping
Bought by
Ferraro Peter
Purchase Details
Closed on
Sep 9, 1987
Sold by
Gorski Alice H
Bought by
Pell Luping
Create a Home Valuation Report for This Property
The Home Valuation Report is an in-depth analysis detailing your home's value as well as a comparison with similar homes in the area
Home Values in the Area
Average Home Value in this Area
Purchase History
| Date | Buyer | Sale Price | Title Company |
|---|---|---|---|
| Bradley C Silva T C | -- | None Available | |
| Bradley C Silva T C | -- | None Available | |
| Silver Bradley C | $245,000 | -- | |
| Silver Bradley C | $245,000 | -- | |
| Carlos Cathy T | $130,000 | -- | |
| Purucker Brent A | $120,000 | -- | |
| Silver Bradley C | $245,000 | -- | |
| Carlos Cathy T | $130,000 | -- | |
| Purucker Brent A | $120,000 | -- | |
| Ferraro Peter | $134,900 | -- | |
| Pell Luping | $120,000 | -- |
Source: Public Records
Mortgage History
| Date | Status | Borrower | Loan Amount |
|---|---|---|---|
| Previous Owner | Silver Bradley C | $196,000 | |
| Previous Owner | Pell Luping | $98,500 |
Source: Public Records
Tax History Compared to Growth
Tax History
| Year | Tax Paid | Tax Assessment Tax Assessment Total Assessment is a certain percentage of the fair market value that is determined by local assessors to be the total taxable value of land and additions on the property. | Land | Improvement |
|---|---|---|---|---|
| 2025 | $5,995 | $335,300 | $87,600 | $247,700 |
| 2024 | $5,741 | $310,300 | $87,600 | $222,700 |
| 2023 | $5,258 | $293,600 | $87,600 | $206,000 |
| 2022 | $5,258 | $256,600 | $87,600 | $169,000 |
| 2021 | $5,001 | $217,800 | $96,200 | $121,600 |
| 2020 | $4,874 | $217,800 | $96,200 | $121,600 |
| 2019 | $4,748 | $217,800 | $96,200 | $121,600 |
| 2018 | $4,505 | $199,000 | $96,200 | $102,800 |
| 2017 | $4,378 | $199,000 | $96,200 | $102,800 |
| 2016 | $3,948 | $182,800 | $102,100 | $80,700 |
| 2015 | $3,817 | $182,800 | $102,100 | $80,700 |
Source: Public Records
Map
Nearby Homes
- 1028 Tinkham Rd
- 6 Katie St
- 3 Sawmill Dr
- 68 Monson Rd
- 5 Old Carriage Dr
- 767 Stony Hill Rd
- 760 Stony Hill Rd
- 763 Stony Hill Rd
- 14 Brookdale Dr
- 5 Edgewood Rd
- 230V Burleigh Rd
- 390 Soule Rd
- 8 Patriot Ridge Ln
- 500 Springfield St
- 17 Peak Rd
- 6 Hilltop Park
- 41 Brookside Dr
- 27 Eastwood Dr
- 19 Forest Hill Rd
- 374
- 1047 Tinkham Rd
- 1051 Tinkham Rd
- 1051 Tinkham Rd Unit 1
- 2 Mountainbrook Rd
- 1 Mountainbrook Rd
- 4 Mountainbrook Rd
- 3 Mountainbrook Rd
- 1055 Tinkham Rd
- 1031 Tinkham Rd
- 6 Mountainbrook Rd
- 6 Edward St
- 8 Mountainbrook Rd
- 4 Edward St
- 3 Evangeline Dr
- 1036 Tinkham Rd
- 1025 Tinkham Rd
- 5 Evangeline Dr
- 10 Mountainbrook Rd
- 7 Evangeline Dr
- 11 Mountainbrook Rd