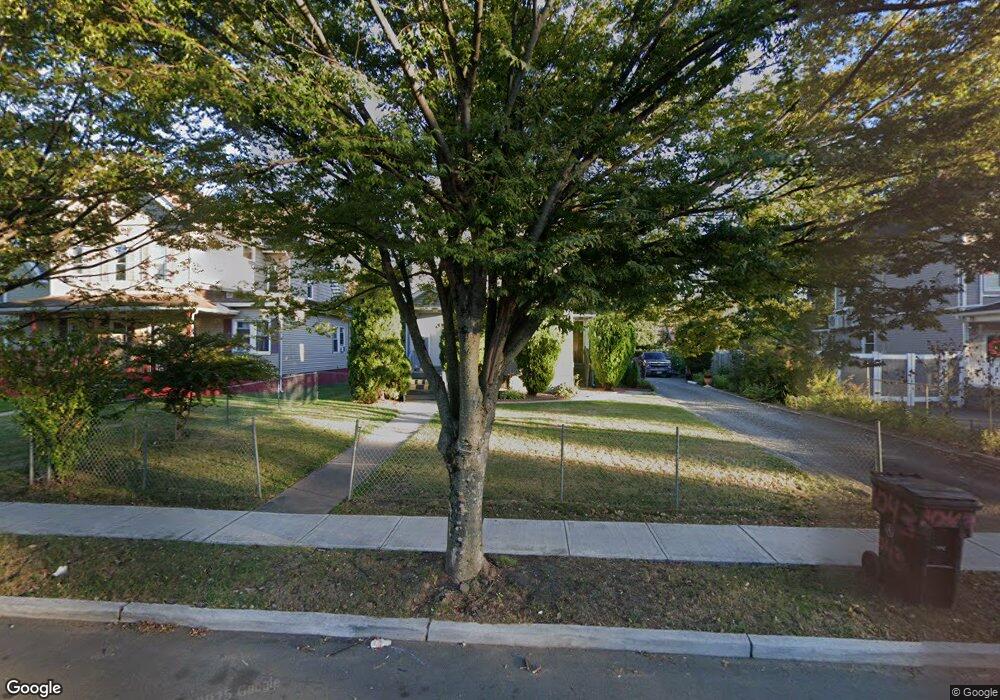
1043 W Front St Unit 45 Plainfield, NJ 07063
Estimated Value: $273,000 - $622,000
--
Bed
--
Bath
1,908
Sq Ft
$258/Sq Ft
Est. Value
About This Home
This home is located at 1043 W Front St Unit 45, Plainfield, NJ 07063 and is currently estimated at $492,574, approximately $258 per square foot. 1043 W Front St Unit 45 is a home located in Union County with nearby schools including Jefferson Elementary School, Hubbard Middle School, and Plainfield High School.
Ownership History
Date
Name
Owned For
Owner Type
Purchase Details
Closed on
Sep 2, 2003
Sold by
Aragon Rubi
Bought by
Aragon Rubi and Aragon Gladys
Current Estimated Value
Home Financials for this Owner
Home Financials are based on the most recent Mortgage that was taken out on this home.
Original Mortgage
$198,000
Outstanding Balance
$92,294
Interest Rate
6.31%
Estimated Equity
$400,280
Purchase Details
Closed on
Dec 10, 2001
Sold by
Mora Carlos and Mora Carmen Julia
Bought by
Aragon Rubi A and Alvarez Gladys
Home Financials for this Owner
Home Financials are based on the most recent Mortgage that was taken out on this home.
Original Mortgage
$162,450
Interest Rate
6.6%
Mortgage Type
FHA
Purchase Details
Closed on
Dec 22, 2000
Sold by
Swarez Felix and Chaban Nasin
Bought by
Mora Carlos A and Mora Carmen Julia
Purchase Details
Closed on
Aug 31, 1999
Sold by
Tristar Investments Llc
Bought by
Chaban Nafin and Swarez Felix
Purchase Details
Closed on
Feb 25, 1998
Sold by
Franklin Harold and Franklin Sylvia H
Bought by
Tristar Investments Llc
Create a Home Valuation Report for This Property
The Home Valuation Report is an in-depth analysis detailing your home's value as well as a comparison with similar homes in the area
Home Values in the Area
Average Home Value in this Area
Purchase History
| Date | Buyer | Sale Price | Title Company |
|---|---|---|---|
| Aragon Rubi | -- | -- | |
| Aragon Rubi A | $165,000 | -- | |
| Mora Carlos A | $33,000 | -- | |
| Chaban Nafin | $29,000 | -- | |
| Tristar Investments Llc | $42,000 | -- |
Source: Public Records
Mortgage History
| Date | Status | Borrower | Loan Amount |
|---|---|---|---|
| Open | Aragon Rubi | $198,000 | |
| Previous Owner | Aragon Rubi A | $162,450 |
Source: Public Records
Tax History Compared to Growth
Tax History
| Year | Tax Paid | Tax Assessment Tax Assessment Total Assessment is a certain percentage of the fair market value that is determined by local assessors to be the total taxable value of land and additions on the property. | Land | Improvement |
|---|---|---|---|---|
| 2025 | $9,518 | $109,000 | $50,200 | $58,800 |
| 2024 | $9,424 | $109,000 | $50,200 | $58,800 |
| 2023 | $9,424 | $109,000 | $50,200 | $58,800 |
| 2022 | $9,220 | $109,000 | $50,200 | $58,800 |
| 2021 | $9,140 | $109,000 | $50,200 | $58,800 |
| 2020 | $9,113 | $109,000 | $50,200 | $58,800 |
| 2019 | $9,113 | $109,000 | $50,200 | $58,800 |
| 2018 | $8,923 | $109,000 | $50,200 | $58,800 |
| 2017 | $8,705 | $109,000 | $50,200 | $58,800 |
| 2016 | $8,527 | $109,000 | $50,200 | $58,800 |
| 2015 | $8,275 | $109,000 | $50,200 | $58,800 |
| 2014 | -- | $109,000 | $50,200 | $58,800 |
Source: Public Records
Map
Nearby Homes
- 20-22 Albert St
- 667 S 2nd St
- 951 W Front St
- 1637 S 2nd St
- 223 Monroe Ave
- 318-20 Manson Place
- 312 Monroe Ave Unit 14
- 318 Halsey St Unit 20
- 40 Emma St Unit 42
- 333 Mcdowell St Unit 35
- 338 Manson Place Unit 40
- 1222 W 3rd St Unit 24
- 73-81 Mariners Ct
- 954 W 4th St
- 355 Bergen St
- 829 S 2nd St
- 325-29 Stebbins Place Unit 4
- 421 Tappan Ave Unit 27
- 950 W 6th St Unit 52
- 1357-1403 S 2nd St Unit 2
- 1039 W Front St Unit 41
- 1047 W Front St Unit 49
- 1039-41 W Front St
- 1035 W Front St Unit 37
- 1101 W Front St Unit 3
- 1035-37 W Front St
- 1031 W Front St Unit 33
- 1105 W Front St Unit 7
- 24 Albert St Unit 28
- 24 Albert St
- 1109 W Front St
- 1027 W Front St Unit 29
- 1044 W Front St Unit 46
- 1040 W Front St Unit 42
- 6 Albert St
- 1111 W Front St Unit 13
- 1036 W Front St Unit 38
- 8 Albert St Unit 10
- 1025 W Front St
- 1100 W Front St Unit 4