Estimated Value: $489,576 - $503,000
3
Beds
3
Baths
2,015
Sq Ft
$247/Sq Ft
Est. Value
About This Home
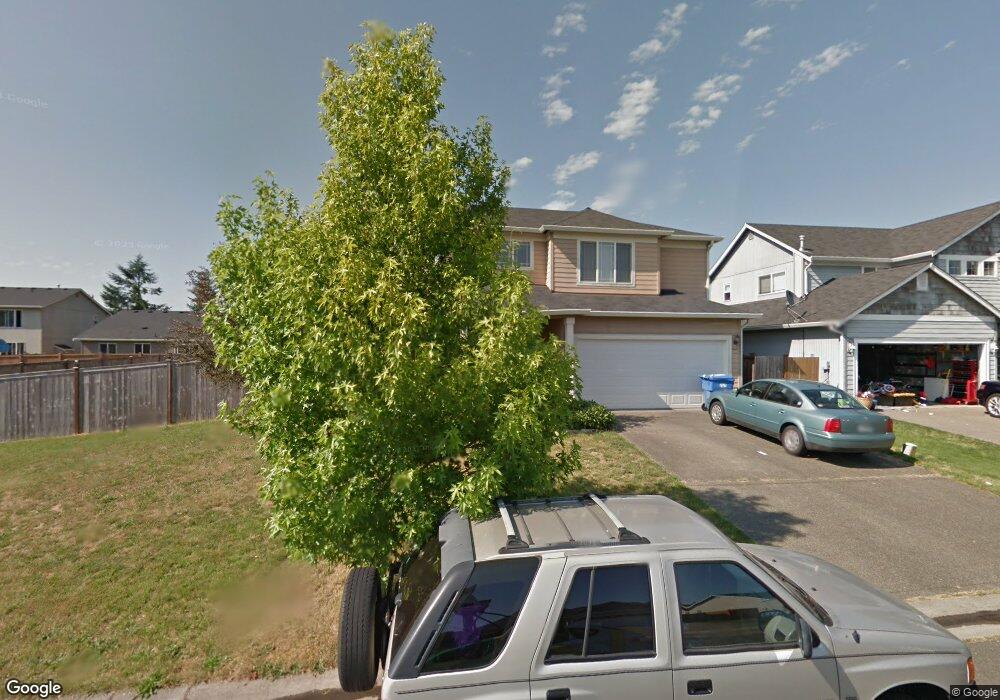
This home is located at 10433 Red Fern Ct SE, Yelm, WA 98597 and is currently estimated at $497,894, approximately $247 per square foot. 10433 Red Fern Ct SE is a home located in Thurston County with nearby schools including Mill Pond Elementary School, Ridgeline Middle School, and Yelm High School.
Ownership History
Date
Name
Owned For
Owner Type
Purchase Details
Closed on
Jul 8, 2015
Sold by
Shankle Sheila
Bought by
Shankle Sheila and Shintaku Brent
Current Estimated Value
Purchase Details
Closed on
Sep 19, 2013
Sold by
Shankle Brett
Bought by
Shankle Shiela
Purchase Details
Closed on
Jun 11, 2002
Sold by
Harr Construction Inc
Bought by
Shankle Brett A and Shankle Sheila
Home Financials for this Owner
Home Financials are based on the most recent Mortgage that was taken out on this home.
Original Mortgage
$154,700
Outstanding Balance
$65,087
Interest Rate
6.74%
Estimated Equity
$432,807
Purchase Details
Closed on
Jan 28, 2002
Sold by
Harr Family Homes Inc
Bought by
Harr Construction Inc
Home Financials for this Owner
Home Financials are based on the most recent Mortgage that was taken out on this home.
Original Mortgage
$346,200
Interest Rate
7.17%
Create a Home Valuation Report for This Property
The Home Valuation Report is an in-depth analysis detailing your home's value as well as a comparison with similar homes in the area
Home Values in the Area
Average Home Value in this Area
Purchase History
| Date | Buyer | Sale Price | Title Company |
|---|---|---|---|
| Shankle Sheila | -- | None Available | |
| Shankle Shiela | -- | None Available | |
| Shankle Brett A | $159,490 | First American Title Ins Co | |
| Harr Construction Inc | $196,000 | First American Title Ins Co | |
| Harr Construction Inc | $112,500 | First American Title Ins Co |
Source: Public Records
Mortgage History
| Date | Status | Borrower | Loan Amount |
|---|---|---|---|
| Open | Shankle Brett A | $154,700 | |
| Previous Owner | Harr Construction Inc | $346,200 | |
| Previous Owner | Harr Construction Inc | $599,600 |
Source: Public Records
Tax History Compared to Growth
Tax History
| Year | Tax Paid | Tax Assessment Tax Assessment Total Assessment is a certain percentage of the fair market value that is determined by local assessors to be the total taxable value of land and additions on the property. | Land | Improvement |
|---|---|---|---|---|
| 2024 | $3,858 | $418,300 | $130,400 | $287,900 |
| 2023 | $3,858 | $395,200 | $108,900 | $286,300 |
| 2022 | $3,427 | $384,300 | $64,200 | $320,100 |
| 2021 | $3,290 | $311,200 | $69,900 | $241,300 |
| 2020 | $3,093 | $259,700 | $52,600 | $207,100 |
| 2019 | $2,438 | $238,500 | $43,400 | $195,100 |
| 2018 | $2,711 | $199,900 | $22,900 | $177,000 |
| 2017 | $2,513 | $194,200 | $22,800 | $171,400 |
| 2016 | -- | $184,900 | $31,000 | $153,900 |
| 2014 | -- | $173,300 | $32,000 | $141,300 |
Source: Public Records
Map
Nearby Homes
- 15120 Carter Loop SE
- 15130 Carter Loop SE
- 15328 104th Ave SE
- 15316 Carter Ct SE
- 15315 Carter Ct SE
- 10412 Barry Bridges St SE
- 14944 100th Ave SE
- 15418 107th Loop SE
- 14912 99th Way SE
- 14854 99th Way SE
- 14933 Terra View St SE
- 14944 Terra View St SE
- 10071 Jensen Dr SE
- 108 Washington Ct SE
- 15739 Yelm Terra Way SE
- 606 Yelm Ave W
- 9945 Justman St SE
- The Sutton Plan at Tahoma Terra
- The Teton Plan at Tahoma Terra
- The Cedar Plan at Tahoma Terra
- 10426 Red Fern Ct SE
- 15204 105th Ave SE
- 15148 105th Ave SE
- 15210 105th Ave SE
- 15216 105th Ave SE
- 15142 105th Ave SE
- 10421 Red Fern Ct SE
- 10420 Red Fern Ct SE
- 10415 Red Fern Ct SE
- 10425 Red Fern Ct SE
- 15228 105th Ave SE
- 15118 105th Ave SE
- 10434 Brighton St SE
- 15048 105th Ave SE
- 15203 105th Ave SE
- 10436 Brighton St SE
- 10432 Brighton St SE
- 15209 105th Ave SE
- 10411 Red Fern Ct SE
- 15149 105th Ave SE