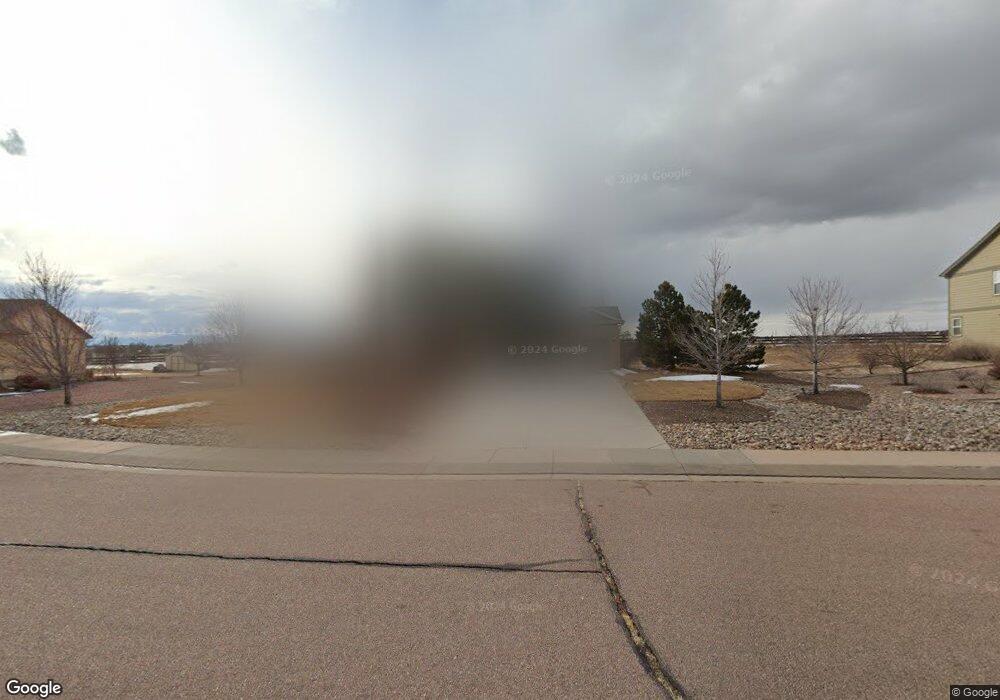
10434 Pictured Rocks Dr Peyton, CO 80831
Falcon NeighborhoodEstimated Value: $590,637 - $657,000
5
Beds
4
Baths
2,299
Sq Ft
$269/Sq Ft
Est. Value
About This Home
This home is located at 10434 Pictured Rocks Dr, Peyton, CO 80831 and is currently estimated at $617,659, approximately $268 per square foot. 10434 Pictured Rocks Dr is a home located in El Paso County with nearby schools including Meridian Ranch Elementary School, Falcon Middle School, and Falcon High School.
Ownership History
Date
Name
Owned For
Owner Type
Purchase Details
Closed on
Sep 8, 2017
Sold by
Emrich Peter J and Krawczyk Shelby
Bought by
Malcom Blake Jonathan and Malcom Janey Halle
Current Estimated Value
Home Financials for this Owner
Home Financials are based on the most recent Mortgage that was taken out on this home.
Original Mortgage
$323,023
Outstanding Balance
$269,892
Interest Rate
3.92%
Mortgage Type
VA
Estimated Equity
$347,767
Purchase Details
Closed on
Oct 31, 2005
Sold by
Lennar Colorado Llc
Bought by
Emrich Peter J and Krawczyk Shelby
Home Financials for this Owner
Home Financials are based on the most recent Mortgage that was taken out on this home.
Original Mortgage
$235,150
Interest Rate
5.92%
Mortgage Type
Fannie Mae Freddie Mac
Purchase Details
Closed on
Feb 17, 2005
Sold by
Gtl Inc
Bought by
Lennar Colorado Llc
Create a Home Valuation Report for This Property
The Home Valuation Report is an in-depth analysis detailing your home's value as well as a comparison with similar homes in the area
Home Values in the Area
Average Home Value in this Area
Purchase History
| Date | Buyer | Sale Price | Title Company |
|---|---|---|---|
| Malcom Blake Jonathan | $335,000 | Empire Title Of Colorado Spr | |
| Emrich Peter J | $295,158 | North American Title | |
| Lennar Colorado Llc | $66,000 | Fahtco |
Source: Public Records
Mortgage History
| Date | Status | Borrower | Loan Amount |
|---|---|---|---|
| Open | Malcom Blake Jonathan | $323,023 | |
| Previous Owner | Emrich Peter J | $235,150 |
Source: Public Records
Tax History
| Year | Tax Paid | Tax Assessment Tax Assessment Total Assessment is a certain percentage of the fair market value that is determined by local assessors to be the total taxable value of land and additions on the property. | Land | Improvement |
|---|---|---|---|---|
| 2025 | $4,156 | $43,730 | -- | -- |
| 2024 | $4,023 | $44,240 | $9,000 | $35,240 |
| 2022 | $2,715 | $26,900 | $7,390 | $19,510 |
| 2021 | $2,814 | $27,670 | $7,600 | $20,070 |
| 2020 | $3,036 | $27,680 | $6,890 | $20,790 |
| 2019 | $2,839 | $26,030 | $6,890 | $19,140 |
| 2018 | $2,525 | $22,920 | $6,300 | $16,620 |
| 2017 | $2,388 | $22,920 | $6,300 | $16,620 |
| 2016 | $2,276 | $22,360 | $6,970 | $15,390 |
| 2015 | $2,277 | $22,360 | $6,970 | $15,390 |
| 2014 | $2,095 | $20,320 | $5,970 | $14,350 |
Source: Public Records
Map
Nearby Homes
- 10467 Pictured Rocks Dr
- 10488 Cedar Breaks Dr
- 10429 Cedar Breaks Dr
- 10489 Cedar Breaks Dr
- 10342 Biscayne Dr
- 11674 Allendale Dr
- 12320 Grand Teton Dr
- 10476 Ross Lake Dr
- 12144 Point Reyes Dr
- 10803 Greenbelt Dr
- 12252 Point Reyes Dr
- 10603 Ross Lake Dr
- 12534 Angelina Dr
- 12705 Angelina Dr
- 12272 Isle Royale Dr
- 11650 Cranston Dr
- 10135 Kings Canyon Dr
- 9880 Everglades Dr
- 11280 Allendale Dr
- 12216 Chimney Smoke Dr
- 10450 Pictured Rocks Dr
- 10418 Pictured Rocks Dr
- 10435 Pictured Rocks Dr
- 10466 Pictured Rocks Dr
- 10451 Pictured Rocks Dr
- 10402 Pictured Rocks Dr
- 10514 Pictured Rocks Dr
- 10483 Pictured Rocks Dr
- 10515 Pictured Rocks Dr
- 10499 Pictured Rocks Dr
- 10531 Pictured Rocks Dr
- 10546 Pictured Rocks Dr
- 11845 Sunset Crater Dr
- 11805 Sunset Crater Dr
- 11865 Sunset Crater Dr
- 11825 Sunset Crater Dr
- 10452 Cedar Breaks Dr
- 10464 Cedar Breaks Dr
- 10440 Cedar Breaks Dr
- 10476 Cedar Breaks Dr
Your Personal Tour Guide
Ask me questions while you tour the home.