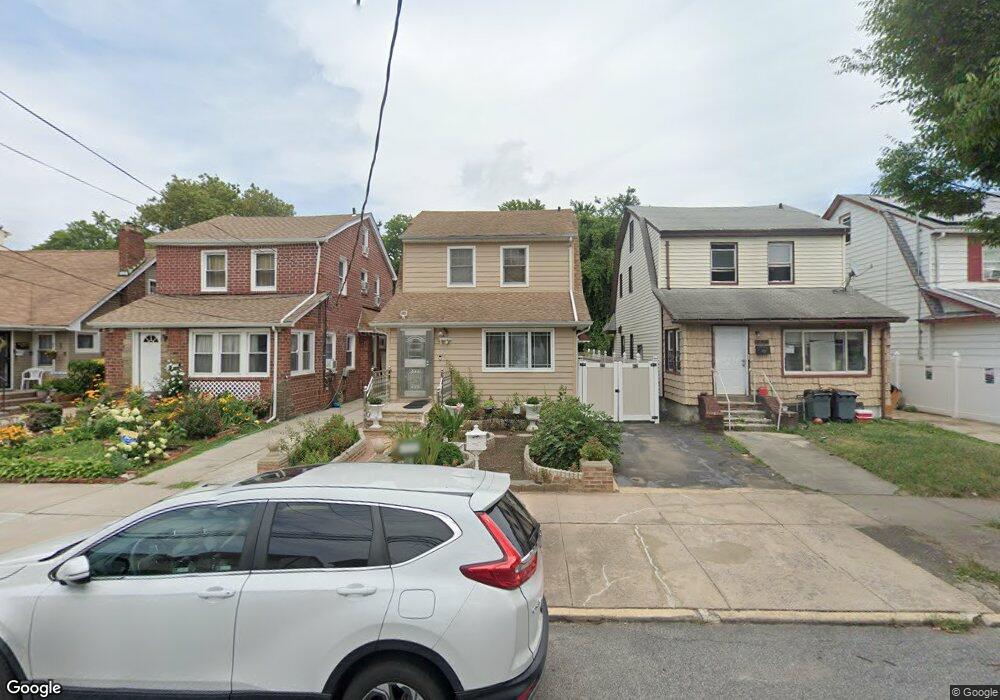
10437 210th St Queens Village, NY 11429
Queens Village NeighborhoodEstimated Value: $667,000 - $926,000
--
Bed
--
Bath
1,558
Sq Ft
$500/Sq Ft
Est. Value
About This Home
This home is located at 10437 210th St, Queens Village, NY 11429 and is currently estimated at $778,280, approximately $499 per square foot. 10437 210th St is a home located in Queens County with nearby schools including P.S. 134 Langston Hughes School, I.S. 192 The Linden, and Ss Joachim & Anne School.
Ownership History
Date
Name
Owned For
Owner Type
Purchase Details
Closed on
Sep 25, 2006
Sold by
Hernadez Ledvia and Hernadez Luis
Bought by
Hernadez Ledvia
Current Estimated Value
Home Financials for this Owner
Home Financials are based on the most recent Mortgage that was taken out on this home.
Original Mortgage
$307,000
Outstanding Balance
$181,670
Interest Rate
6.31%
Mortgage Type
Purchase Money Mortgage
Estimated Equity
$596,610
Purchase Details
Closed on
Nov 11, 2005
Sold by
Hernandez Luis and Hernandez Luis A
Bought by
Hernandez Ledvia and Hernandez Luis
Purchase Details
Closed on
Aug 23, 1999
Sold by
Williams Neville and Williams Steven
Bought by
Hernandez Luis A and Hernandez Luis
Home Financials for this Owner
Home Financials are based on the most recent Mortgage that was taken out on this home.
Original Mortgage
$169,913
Interest Rate
7.8%
Mortgage Type
FHA
Create a Home Valuation Report for This Property
The Home Valuation Report is an in-depth analysis detailing your home's value as well as a comparison with similar homes in the area
Home Values in the Area
Average Home Value in this Area
Purchase History
| Date | Buyer | Sale Price | Title Company |
|---|---|---|---|
| Hernadez Ledvia | -- | -- | |
| Hernadez Ledvia | -- | -- | |
| Hernandez Ledvia | -- | -- | |
| Hernandez Ledvia | -- | -- | |
| Hernandez Luis A | $170,000 | -- | |
| Hernandez Luis A | $170,000 | -- |
Source: Public Records
Mortgage History
| Date | Status | Borrower | Loan Amount |
|---|---|---|---|
| Open | Hernadez Ledvia | $307,000 | |
| Closed | Hernadez Ledvia | $307,000 | |
| Previous Owner | Hernandez Luis A | $169,913 |
Source: Public Records
Tax History Compared to Growth
Tax History
| Year | Tax Paid | Tax Assessment Tax Assessment Total Assessment is a certain percentage of the fair market value that is determined by local assessors to be the total taxable value of land and additions on the property. | Land | Improvement |
|---|---|---|---|---|
| 2025 | $5,468 | $30,340 | $8,714 | $21,626 |
| 2024 | $5,480 | $28,624 | $9,313 | $19,311 |
| 2023 | $5,143 | $27,004 | $8,826 | $18,178 |
| 2022 | $4,799 | $37,680 | $13,080 | $24,600 |
| 2021 | $5,066 | $33,720 | $13,080 | $20,640 |
| 2020 | $5,056 | $37,080 | $13,080 | $24,000 |
| 2019 | $4,697 | $35,880 | $13,080 | $22,800 |
| 2018 | $4,290 | $22,503 | $10,032 | $12,471 |
| 2017 | $4,028 | $21,232 | $11,207 | $10,025 |
| 2016 | $3,935 | $21,232 | $11,207 | $10,025 |
| 2015 | $2,196 | $21,069 | $12,497 | $8,572 |
| 2014 | $2,196 | $19,878 | $12,897 | $6,981 |
Source: Public Records
Map
Nearby Homes
- 104-50 210th St
- 104-24 210th St
- 10925 208th St
- 109-28 212th St
- 10022 Bellaire Place
- 100-24 210th St
- 104-37 214th St
- 10219 213th St
- 10221 213th St
- 106-16 215th St
- 208-17 100th Ave
- 213-19 102nd Ave
- 110-06 209th Place
- 100-28 207th St
- 109-12 Francis Lewis Blvd
- 9904 212th St
- 99-02 212th St
- 99-02 212 St
- 109-09 215th St
- 11044 208th St
- 10439 210th St
- 10433 210th St
- 10439 210th St
- 104-33 210th St
- 10443 210th St
- 10429 210th St
- 104-43 210th St
- 104-29 210th St
- 10445 210th St
- 10425 210th St
- 104-25 210th St
- 104-25 210th St Unit 2Fl
- 104-25 210th St Unit 1st Fl
- 104-25 210th St Unit 2nd Fl
- 10440 211th St
- 21001 109th Ave
- 10432 211th St
- 10444 211th St
- 10423 210th St
- 10428 211th St