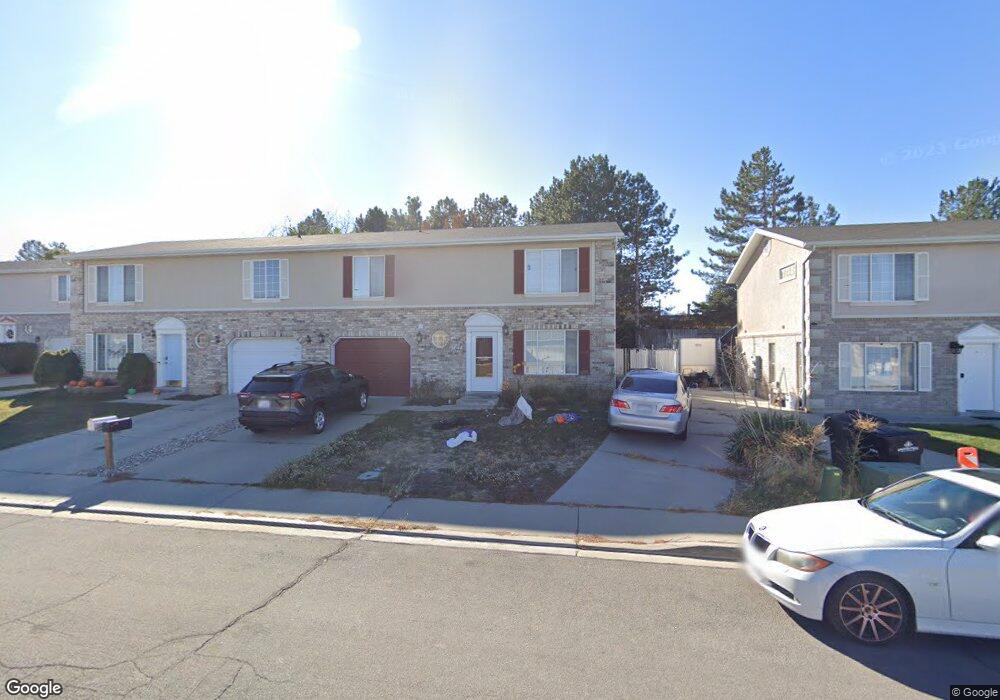
1044 E 60 S Spanish Fork, UT 84660
Estimated Value: $380,000 - $434,000
4
Beds
3
Baths
1,482
Sq Ft
$271/Sq Ft
Est. Value
About This Home
This home is located at 1044 E 60 S, Spanish Fork, UT 84660 and is currently estimated at $401,070, approximately $270 per square foot. 1044 E 60 S is a home located in Utah County with nearby schools including Larsen Elementary School, Spanish Fork Jr High School, and Spanish Fork High School.
Ownership History
Date
Name
Owned For
Owner Type
Purchase Details
Closed on
Jun 1, 2015
Sold by
Lacefield Gregory M
Bought by
Gordon Melissa
Current Estimated Value
Home Financials for this Owner
Home Financials are based on the most recent Mortgage that was taken out on this home.
Original Mortgage
$166,920
Outstanding Balance
$129,835
Interest Rate
3.87%
Mortgage Type
FHA
Estimated Equity
$271,235
Purchase Details
Closed on
Feb 25, 2008
Sold by
Lacefield Gregory Mark
Bought by
Lacefield Gregory M
Home Financials for this Owner
Home Financials are based on the most recent Mortgage that was taken out on this home.
Original Mortgage
$160,040
Interest Rate
5.64%
Mortgage Type
New Conventional
Create a Home Valuation Report for This Property
The Home Valuation Report is an in-depth analysis detailing your home's value as well as a comparison with similar homes in the area
Home Values in the Area
Average Home Value in this Area
Purchase History
| Date | Buyer | Sale Price | Title Company |
|---|---|---|---|
| Gordon Melissa | -- | Inwest Title Services | |
| Lacefield Gregory M | -- | First American Union Park |
Source: Public Records
Mortgage History
| Date | Status | Borrower | Loan Amount |
|---|---|---|---|
| Open | Gordon Melissa | $166,920 | |
| Previous Owner | Lacefield Gregory M | $160,040 |
Source: Public Records
Tax History
| Year | Tax Paid | Tax Assessment Tax Assessment Total Assessment is a certain percentage of the fair market value that is determined by local assessors to be the total taxable value of land and additions on the property. | Land | Improvement |
|---|---|---|---|---|
| 2025 | $1,937 | $202,730 | -- | -- |
| 2024 | $1,937 | $199,650 | $0 | $0 |
| 2023 | $1,966 | $202,840 | $0 | $0 |
| 2022 | $1,681 | $170,115 | $0 | $0 |
| 2021 | $1,487 | $240,700 | $68,700 | $172,000 |
| 2020 | $1,403 | $220,800 | $68,700 | $152,100 |
| 2019 | $1,284 | $212,700 | $68,700 | $144,000 |
| 2018 | $1,111 | $177,900 | $68,700 | $109,200 |
| 2017 | $954 | $82,115 | $0 | $0 |
| 2016 | $924 | $78,430 | $0 | $0 |
| 2015 | $885 | $74,250 | $0 | $0 |
| 2014 | $764 | $64,350 | $0 | $0 |
Source: Public Records
Map
Nearby Homes
- 973 E 60 S
- 136 N 1120 E
- 1238 E 100 S
- 306 N 1070 E
- 306 N 1070 E Unit 17
- 274 N 1070 E Unit 14
- 299 N 1070 E Unit 8
- 212 N 1070 E Unit 9
- 224 N 1070 E Unit 10
- 284 N 1000 E
- 998 E 260 N Unit 16
- 992 E 260 N Unit 15
- 314 N 1070 E
- 325 S 1230 E
- 2998 Canyon Dr Unit 333
- 3014 Canyon Dr Unit 332
- 277 S 700 E
- 1455 E 100 S
- 2583 E 300 S Unit 21
- 1330 E 410 S
Your Personal Tour Guide
Ask me questions while you tour the home.