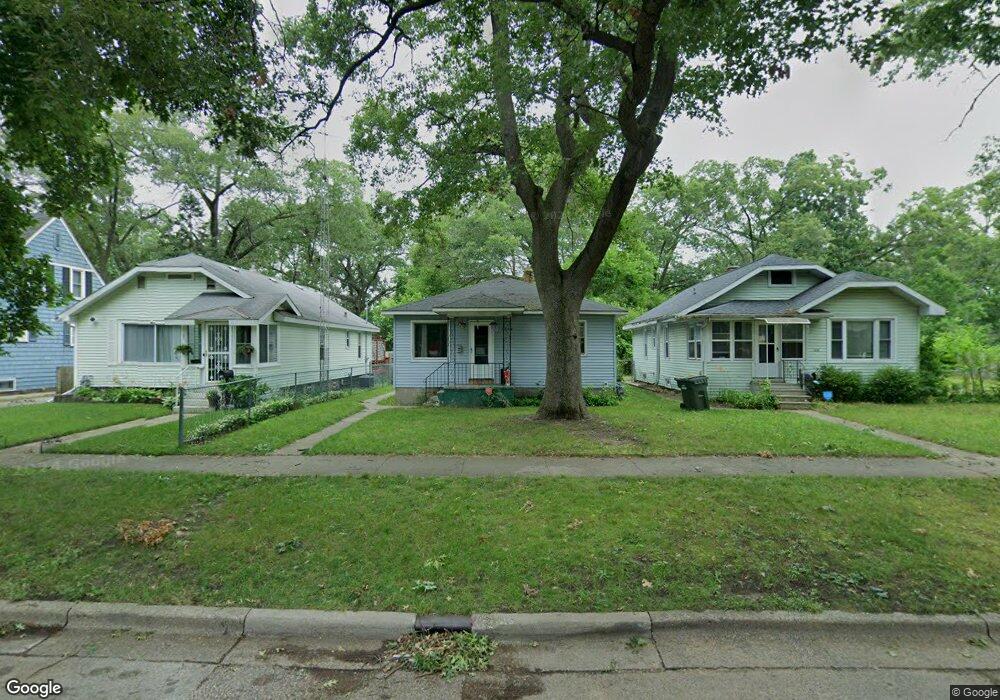
1044 E Isabella Ave Muskegon, MI 49442
Sheldon Park NeighborhoodEstimated Value: $136,000 - $159,000
2
Beds
1
Bath
884
Sq Ft
$167/Sq Ft
Est. Value
About This Home
This home is located at 1044 E Isabella Ave, Muskegon, MI 49442 and is currently estimated at $147,543, approximately $166 per square foot. 1044 E Isabella Ave is a home located in Muskegon County with nearby schools including Three Oaks Public School Academy, Muskegon Maritime Academy, and Muskegan Christian School.
Ownership History
Date
Name
Owned For
Owner Type
Purchase Details
Closed on
Apr 27, 2021
Sold by
Jasick Gary L and Jasick Guy A
Bought by
Fisk Sharon A
Current Estimated Value
Purchase Details
Closed on
Jan 16, 2021
Sold by
Jasick Gary L and Jasick Arlene B
Bought by
Jasick Arlene B and Jasick Gary L
Purchase Details
Closed on
Jan 2, 2014
Sold by
Jasick Arthur and Jasick Arleen
Bought by
Williams Rosemary and Harvey William
Home Financials for this Owner
Home Financials are based on the most recent Mortgage that was taken out on this home.
Original Mortgage
$50,000
Interest Rate
9%
Mortgage Type
Seller Take Back
Purchase Details
Closed on
Jul 8, 2011
Sold by
Jasick Arthur
Bought by
Brown Ely
Purchase Details
Closed on
Feb 5, 2010
Sold by
Gillispie Muhammad Rasheedah
Bought by
Jasick Arthur and Jasick Arlene
Create a Home Valuation Report for This Property
The Home Valuation Report is an in-depth analysis detailing your home's value as well as a comparison with similar homes in the area
Home Values in the Area
Average Home Value in this Area
Purchase History
| Date | Buyer | Sale Price | Title Company |
|---|---|---|---|
| Fisk Sharon A | -- | None Available | |
| Fisk Sharon A | -- | None Listed On Document | |
| Jasick Arlene B | -- | None Available | |
| Jasick Arlene B | -- | None Listed On Document | |
| Williams Rosemary | $50,000 | None Available | |
| Brown Ely | -- | None Available | |
| Jasick Arthur | -- | None Available |
Source: Public Records
Mortgage History
| Date | Status | Borrower | Loan Amount |
|---|---|---|---|
| Previous Owner | Williams Rosemary | $50,000 |
Source: Public Records
Tax History Compared to Growth
Tax History
| Year | Tax Paid | Tax Assessment Tax Assessment Total Assessment is a certain percentage of the fair market value that is determined by local assessors to be the total taxable value of land and additions on the property. | Land | Improvement |
|---|---|---|---|---|
| 2025 | $1,568 | $62,500 | $0 | $0 |
| 2024 | $292 | $52,000 | $0 | $0 |
| 2023 | $279 | $44,000 | $0 | $0 |
| 2022 | $1,439 | $31,700 | $0 | $0 |
| 2021 | $1,023 | $29,200 | $0 | $0 |
| 2020 | $992 | $24,000 | $0 | $0 |
| 2019 | $974 | $22,000 | $0 | $0 |
| 2018 | $953 | $22,400 | $0 | $0 |
| 2017 | $920 | $21,900 | $0 | $0 |
| 2016 | $238 | $21,000 | $0 | $0 |
| 2015 | -- | $21,200 | $0 | $0 |
| 2014 | $222 | $20,100 | $0 | $0 |
| 2013 | -- | $19,000 | $0 | $0 |
Source: Public Records
Map
Nearby Homes
- 1059 Ada Ave
- 1068 Ada Ave
- 1044 E Apple Ave
- 1082 E Apple Ave
- 1192 Oak Grove St
- 1075 Mclaughlin Ave
- 1069 Mclaughlin Ave
- 917 E Apple Ave
- 877 E Isabella Ave
- 1168 E Apple Ave
- 846 E Isabella Ave
- 846 Catherine Ave
- 1225 Francis Ave
- 1135 Holt St
- 719 E Apple Ave
- 1255 Langeland Ave
- 725 Allen Ave
- 712 Evanston Ave
- 1211 Howard Ave
- 1022 Kenneth St
- 1038 E Isabella Ave
- 1048 E Isabella Ave
- 1024 E Isabella Ave
- 1043 Ada Ave
- 1043 Ada St
- 1037 Ada St
- 1060 E Isabella Ave
- 1055 Ada St
- 1031 Ada St
- 1025 Ada St
- 0 E Isabella Ave
- 1074 E Isabella Ave
- 1067 Ada Ave
- 1008 E Isabella Ave
- 1059 Ada St
- 1080 E Isabella Ave
- 1002 E Isabella Ave
- 1067 Ada St
- 1007 E Isabella Ave
- 1081 Ada Ave