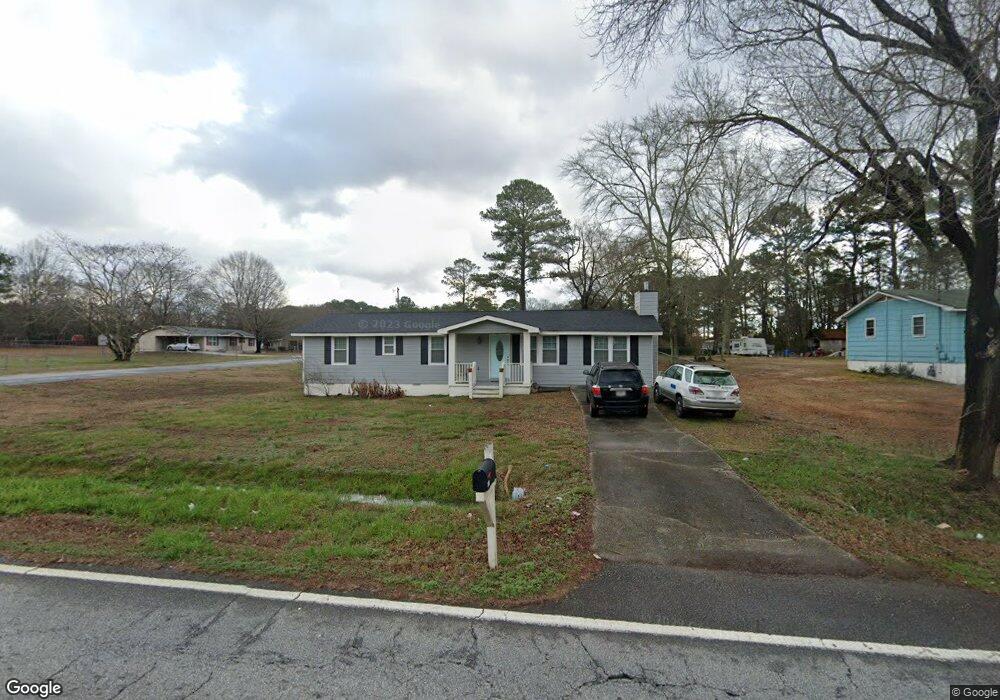
1044 McDaniel Mill Rd SW Conyers, GA 30094
Estimated Value: $201,811 - $231,000
3
Beds
2
Baths
1,344
Sq Ft
$161/Sq Ft
Est. Value
About This Home
This home is located at 1044 McDaniel Mill Rd SW, Conyers, GA 30094 and is currently estimated at $216,453, approximately $161 per square foot. 1044 McDaniel Mill Rd SW is a home located in Rockdale County with nearby schools including Shoal Creek Elementary School, Gen. Ray Davis Middle School, and Rockdale County High School.
Ownership History
Date
Name
Owned For
Owner Type
Purchase Details
Closed on
Aug 31, 2018
Sold by
Quezada Brooke Marie
Bought by
Pinon Sergio Quezada and Quezada Brook Marie
Current Estimated Value
Purchase Details
Closed on
Oct 4, 2011
Sold by
Garcia Rigoberto
Bought by
Nguyen Brooke Marie
Purchase Details
Closed on
Feb 8, 2010
Sold by
Federal Natl Mtg Assn Fnma
Bought by
Garcia Rigoberto
Purchase Details
Closed on
Nov 3, 2009
Sold by
Nationstar Mtg Llc
Bought by
Federal Natl Mtg Assn Fnma
Purchase Details
Closed on
Apr 22, 2003
Sold by
Dickson Robert D
Bought by
Dickson Robert D and Dickson Steven
Create a Home Valuation Report for This Property
The Home Valuation Report is an in-depth analysis detailing your home's value as well as a comparison with similar homes in the area
Home Values in the Area
Average Home Value in this Area
Purchase History
| Date | Buyer | Sale Price | Title Company |
|---|---|---|---|
| Pinon Sergio Quezada | -- | -- | |
| Nguyen Brooke Marie | $20,000 | -- | |
| Garcia Rigoberto | -- | -- | |
| Federal Natl Mtg Assn Fnma | $79,687 | -- | |
| Nationstar Mtg Llc | $79,687 | -- | |
| Dickson Robert D | -- | -- |
Source: Public Records
Tax History Compared to Growth
Tax History
| Year | Tax Paid | Tax Assessment Tax Assessment Total Assessment is a certain percentage of the fair market value that is determined by local assessors to be the total taxable value of land and additions on the property. | Land | Improvement |
|---|---|---|---|---|
| 2024 | $2,482 | $61,200 | $14,040 | $47,160 |
| 2023 | $2,230 | $53,312 | $14,880 | $38,432 |
| 2022 | $1,741 | $41,000 | $10,880 | $30,120 |
| 2021 | $1,571 | $37,280 | $7,160 | $30,120 |
| 2020 | $1,362 | $31,960 | $6,920 | $25,040 |
| 2019 | $1,090 | $24,280 | $5,400 | $18,880 |
| 2018 | $1,095 | $24,280 | $5,400 | $18,880 |
| 2017 | $868 | $19,080 | $4,360 | $14,720 |
| 2016 | $868 | $19,080 | $4,360 | $14,720 |
| 2015 | $836 | $18,360 | $4,000 | $14,360 |
| 2014 | $851 | $18,480 | $4,000 | $14,480 |
| 2013 | -- | $8,000 | $1,953 | $6,046 |
Source: Public Records
Map
Nearby Homes
- 1084 W Adrian Cir SW
- 1107 W Adrian Cir SW
- 1092 W Adrian Cir SW
- 1087 W Adrian Cir SW
- 1103 W Adrian Cir SW
- 2215 Brandon Ln SW Unit 3
- 3495 Heathervale Way SW
- 2204 Brandon Ln SW Unit 2
- 3250 Klondike Rd SW
- 2923 Hurst Rd SW
- 726 McDaniel Mill Rd SW
- 981 Havenridge Dr SW
- 2194 Klondike Rd SW
- 1048 Falls Brooke Dr
- 1221 Rhodes Walk SW
- 1240 Falls Creek Ct
- 2091 Moon Dr SW
- 1509 Shoal Creek Dr SW
- 3906 Rosebay Way SW
- 4058 Rosebay Way SW
- 1052 McDaniel Mill Rd SW
- 1060 Adrian Cir SW
- 1030 McDaniel Mill Rd SW
- 1060 McDaniel Mill Rd SW
- 1061 Adrian Cir SW
- 1058 Adrian Cir SW
- 1045 McDaniel Mill Rd SW
- 1020 McDaniel Mill Rd SW
- 1070 McDaniel Mill Rd SW
- 1056 Adrian Cir SW
- 1029 McDaniel Mill Rd SW
- 1029 Adrian Cir SW
- 2589 Klondike Rd SW
- 1039 McDaniel Mill Rd SW
- 2599 Klondike Rd SW
- 1021 McDaniel Mill Rd SW
- 2573 Klondike Rd SW
- 1072 W Adrian Cir SW
- 1078 McDaniel Mill Rd SW
- 1031 Adrian Cir SW