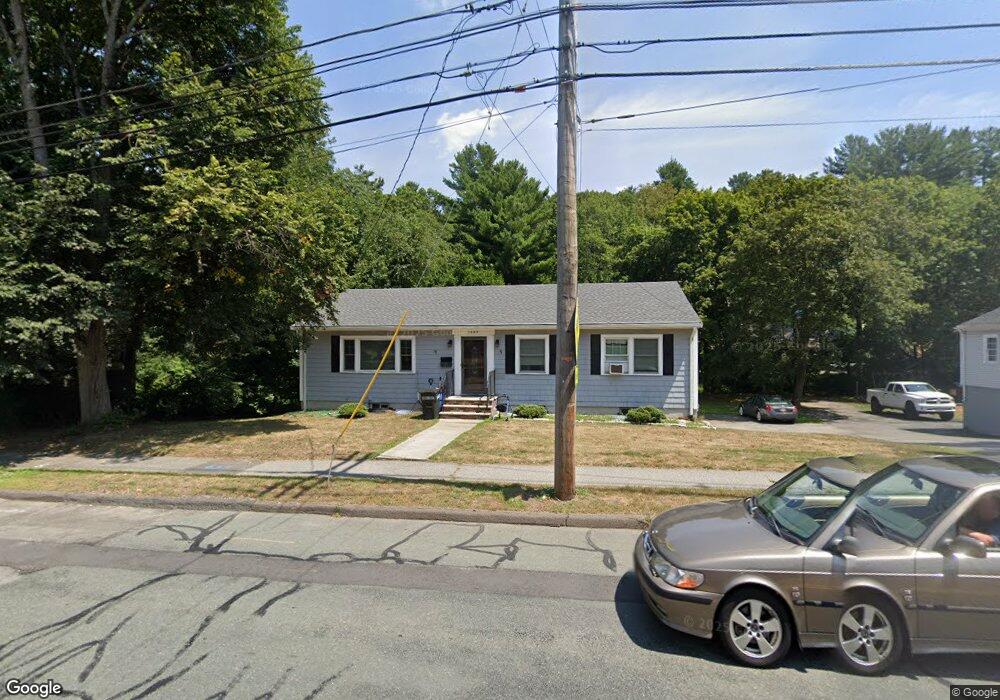
1044 Summer St Lynnfield, MA 01940
Estimated Value: $774,791 - $1,054,000
4
Beds
2
Baths
2,592
Sq Ft
$332/Sq Ft
Est. Value
About This Home
This home is located at 1044 Summer St, Lynnfield, MA 01940 and is currently estimated at $860,948, approximately $332 per square foot. 1044 Summer St is a home located in Essex County with nearby schools including Lynnfield Middle School, Pickering Middle School, and Lynnfield High School.
Ownership History
Date
Name
Owned For
Owner Type
Purchase Details
Closed on
Mar 31, 2006
Sold by
Gordon Elwin R
Bought by
Tasci Ismail
Current Estimated Value
Home Financials for this Owner
Home Financials are based on the most recent Mortgage that was taken out on this home.
Original Mortgage
$52,000
Interest Rate
6.32%
Mortgage Type
Purchase Money Mortgage
Create a Home Valuation Report for This Property
The Home Valuation Report is an in-depth analysis detailing your home's value as well as a comparison with similar homes in the area
Home Values in the Area
Average Home Value in this Area
Purchase History
| Date | Buyer | Sale Price | Title Company |
|---|---|---|---|
| Tasci Ismail | $404,000 | -- |
Source: Public Records
Mortgage History
| Date | Status | Borrower | Loan Amount |
|---|---|---|---|
| Open | Tasci Ismail | $335,000 | |
| Closed | Tasci Ismail | $360,000 | |
| Closed | Tasci Ismail | $90,000 | |
| Closed | Tasci Ismail | $52,000 | |
| Closed | Tasci Ismail | $230,000 |
Source: Public Records
Tax History Compared to Growth
Tax History
| Year | Tax Paid | Tax Assessment Tax Assessment Total Assessment is a certain percentage of the fair market value that is determined by local assessors to be the total taxable value of land and additions on the property. | Land | Improvement |
|---|---|---|---|---|
| 2025 | $7,268 | $688,300 | $494,800 | $193,500 |
| 2024 | $6,576 | $625,700 | $449,800 | $175,900 |
| 2023 | $6,650 | $588,500 | $427,100 | $161,400 |
| 2022 | $6,337 | $528,500 | $392,100 | $136,400 |
| 2021 | $6,344 | $478,100 | $348,400 | $129,700 |
| 2020 | $5,778 | $415,100 | $285,400 | $129,700 |
| 2019 | $5,554 | $399,300 | $269,600 | $129,700 |
| 2018 | $5,404 | $392,700 | $269,600 | $123,100 |
| 2017 | $5,411 | $392,700 | $269,600 | $123,100 |
| 2016 | $5,398 | $372,300 | $257,400 | $114,900 |
| 2015 | $4,986 | $344,100 | $234,600 | $109,500 |
Source: Public Records
Map
Nearby Homes
- 6 Longbow Rd
- 2 Cedarwood Rd
- 344 Broadway
- 807 Salem St
- 14 Rockwood Rd
- 16 Munroe St
- 9 Fernway
- 37 Locust St
- 3 Elliot Rd
- 9 Broadway Unit 217
- 9 Broadway Unit 305
- 5 Otter Pond Rd
- 1100 Salem St Unit 58
- 1100 Salem St Unit 46
- 1100 Salem St Unit 93
- 1100 Salem St Unit 75
- 1200 Salem St Unit 182
- 42 Walnut St
- 51 Walnut St
- 903 Foxwood Cir Unit 903
- 1036 Summer St
- 1050 Summer St
- 1061 Summer St
- 1026 Summer St
- 244 Moulton Dr
- 2 Pyburn Rd
- 20 Nottingham Rd
- 1065 Summer St
- 1 Pyburn Rd
- 1064 Summer St
- 2 Squire Ln
- 18 Nottingham Rd
- 6 Post Office Square Unit 6
- 4 Pyburn Rd
- 19 Nottingham Rd
- 3 Pyburn Rd
- 47 Doncaster Cir
- 3 Squire Ln
- 16 Nottingham Rd
- 6 Pyburn Rd