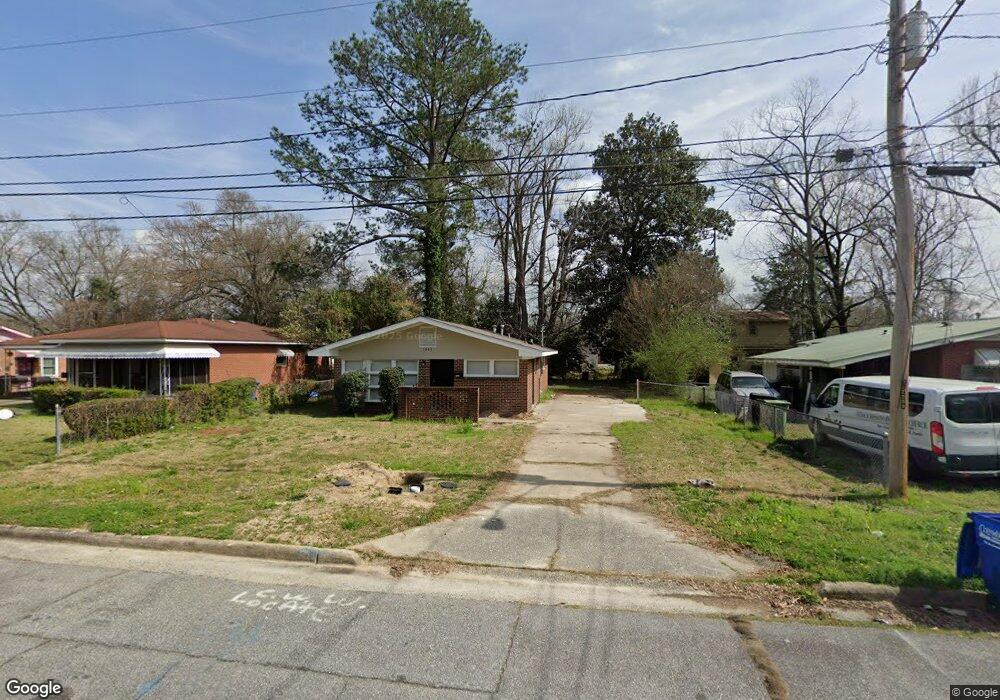
1044 Vera Dr Columbus, GA 31906
East Carver Heights NeighborhoodEstimated Value: $48,000 - $70,071
3
Beds
2
Baths
1,144
Sq Ft
$49/Sq Ft
Est. Value
About This Home
This home is located at 1044 Vera Dr, Columbus, GA 31906 and is currently estimated at $56,018, approximately $48 per square foot. 1044 Vera Dr is a home located in Muscogee County with nearby schools including Brewer Elementary School, Richards Middle School, and Carver High School.
Ownership History
Date
Name
Owned For
Owner Type
Purchase Details
Closed on
Sep 26, 2025
Sold by
Plex Cvr Ii Llc
Bought by
Plex Col De 04 Llc
Current Estimated Value
Home Financials for this Owner
Home Financials are based on the most recent Mortgage that was taken out on this home.
Original Mortgage
$930,000
Outstanding Balance
$930,000
Interest Rate
6.58%
Mortgage Type
New Conventional
Estimated Equity
-$873,982
Purchase Details
Closed on
Apr 16, 2025
Sold by
Plex Capital Investors Llc
Bought by
Plex Cvr Ii Llc
Home Financials for this Owner
Home Financials are based on the most recent Mortgage that was taken out on this home.
Original Mortgage
$4,000,000
Interest Rate
6.67%
Mortgage Type
New Conventional
Purchase Details
Closed on
Nov 27, 2024
Sold by
Alexander Comer J
Bought by
Plex Capital Investors Llc
Purchase Details
Closed on
May 6, 2022
Sold by
Linlock Llc
Bought by
Alexander Comer
Purchase Details
Closed on
May 31, 2019
Sold by
Turner Richard E
Bought by
Linlock Llc
Purchase Details
Closed on
Nov 19, 2010
Sold by
Fannie Mae
Bought by
Turner Richard E
Purchase Details
Closed on
Oct 5, 2010
Sold by
Onewest Bank Fsb
Bought by
Federal National Mortgage Association
Create a Home Valuation Report for This Property
The Home Valuation Report is an in-depth analysis detailing your home's value as well as a comparison with similar homes in the area
Home Values in the Area
Average Home Value in this Area
Purchase History
| Date | Buyer | Sale Price | Title Company |
|---|---|---|---|
| Plex Col De 04 Llc | -- | None Listed On Document | |
| Plex Cvr Ii Llc | -- | None Listed On Document | |
| Plex Cvr Ii Llc | -- | None Listed On Document | |
| Plex Capital Investors Llc | $47,500 | None Listed On Document | |
| Plex Capital Investors Llc | $47,500 | None Listed On Document | |
| Alexander Comer | $2,000 | Rhodes & Warner Pc | |
| Linlock Llc | $125,400 | -- | |
| Turner Richard E | -- | None Available | |
| Federal National Mortgage Association | -- | None Available | |
| Onewest Bank Fsb | $67,968 | None Available |
Source: Public Records
Mortgage History
| Date | Status | Borrower | Loan Amount |
|---|---|---|---|
| Open | Plex Col De 04 Llc | $930,000 | |
| Previous Owner | Plex Cvr Ii Llc | $4,000,000 |
Source: Public Records
Tax History Compared to Growth
Tax History
| Year | Tax Paid | Tax Assessment Tax Assessment Total Assessment is a certain percentage of the fair market value that is determined by local assessors to be the total taxable value of land and additions on the property. | Land | Improvement |
|---|---|---|---|---|
| 2025 | $826 | $21,092 | $3,748 | $17,344 |
| 2024 | $192 | $16,300 | $3,748 | $12,552 |
| 2023 | $642 | $16,300 | $3,748 | $12,552 |
| 2022 | $378 | $9,252 | $3,748 | $5,504 |
| 2021 | $454 | $11,120 | $3,748 | $7,372 |
| 2020 | $443 | $10,857 | $3,408 | $7,449 |
| 2019 | $739 | $18,036 | $3,748 | $14,288 |
| 2018 | $739 | $18,036 | $3,748 | $14,288 |
| 2017 | $741 | $18,036 | $3,748 | $14,288 |
| 2016 | $725 | $17,567 | $2,150 | $15,417 |
| 2015 | $726 | $17,567 | $2,150 | $15,417 |
| 2014 | $726 | $17,567 | $2,150 | $15,417 |
| 2013 | -- | $17,567 | $2,150 | $15,417 |
Source: Public Records
Map
Nearby Homes
- 937 Diggs Ave
- 3570 Stratford Dr
- 3319 Decatur St
- 3415 Terminal St
- 3414 Terminal St
- 776 Terminal Ct
- 3413 Terminal Ct
- 1061 Dunbar Ave
- 800 Morris Rd
- 3122 Glenwood Dr
- 1047 Fisk Ave
- 1312 Glenwood Rd
- 679 Parkchester Dr
- 2937 Thomas St
- 939 Pembrook Dr
- 2925 Colorado St
- 2911 Thomas St
- 2902 Hood St
- 2927 8th St
- 2835 Thomas St