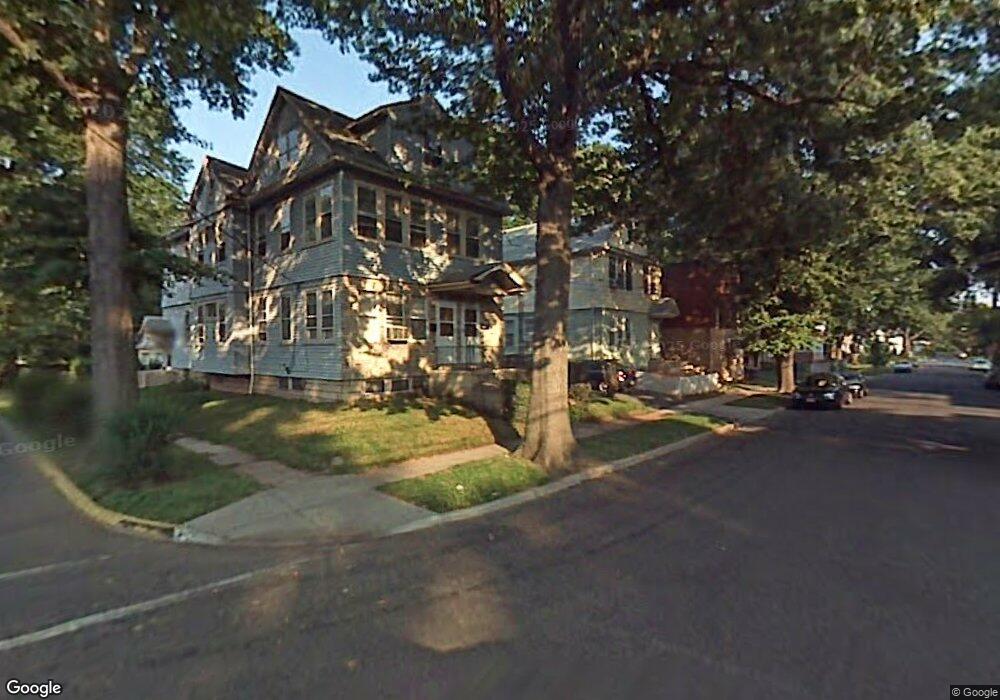
1044 Warren St Unit 3 Roselle, NJ 07203
Estimated Value: $569,979 - $679,000
2
Beds
1
Bath
2,948
Sq Ft
$208/Sq Ft
Est. Value
About This Home
This home is located at 1044 Warren St Unit 3, Roselle, NJ 07203 and is currently estimated at $612,995, approximately $207 per square foot. 1044 Warren St Unit 3 is a home located in Union County with nearby schools including Dr Charles C Polk School, Leonard V. Moore Middle School, and Grace Wilday Junior High School.
Ownership History
Date
Name
Owned For
Owner Type
Purchase Details
Closed on
Jun 29, 2018
Sold by
Snow Richardson Janice and Snow Vincent L
Bought by
Cetin Lisa A and Cetin Mehmet A
Current Estimated Value
Home Financials for this Owner
Home Financials are based on the most recent Mortgage that was taken out on this home.
Original Mortgage
$162,000
Outstanding Balance
$53,501
Interest Rate
4.5%
Mortgage Type
New Conventional
Estimated Equity
$559,494
Purchase Details
Closed on
Dec 5, 2017
Sold by
Snow Richardson Janice and Snow Vincent L
Bought by
Snow Richardson Janice and Snow Vincent L
Create a Home Valuation Report for This Property
The Home Valuation Report is an in-depth analysis detailing your home's value as well as a comparison with similar homes in the area
Home Values in the Area
Average Home Value in this Area
Purchase History
| Date | Buyer | Sale Price | Title Company |
|---|---|---|---|
| Cetin Lisa A | $270,000 | Old Republic Natl Ins Co | |
| Snow Richardson Janice | -- | None Available |
Source: Public Records
Mortgage History
| Date | Status | Borrower | Loan Amount |
|---|---|---|---|
| Open | Cetin Lisa A | $162,000 |
Source: Public Records
Tax History Compared to Growth
Tax History
| Year | Tax Paid | Tax Assessment Tax Assessment Total Assessment is a certain percentage of the fair market value that is determined by local assessors to be the total taxable value of land and additions on the property. | Land | Improvement |
|---|---|---|---|---|
| 2025 | $13,399 | $154,100 | $47,600 | $106,500 |
| 2024 | $13,063 | $154,100 | $47,600 | $106,500 |
| 2023 | $13,063 | $154,100 | $47,600 | $106,500 |
| 2022 | $13,154 | $154,100 | $47,600 | $106,500 |
| 2021 | $13,075 | $154,100 | $47,600 | $106,500 |
| 2020 | $13,034 | $154,100 | $47,600 | $106,500 |
| 2019 | $12,867 | $154,100 | $47,600 | $106,500 |
| 2018 | $12,796 | $154,100 | $47,600 | $106,500 |
| 2017 | $12,729 | $154,100 | $47,600 | $106,500 |
| 2016 | $12,448 | $154,100 | $47,600 | $106,500 |
| 2015 | $12,197 | $154,100 | $47,600 | $106,500 |
| 2014 | $11,850 | $154,100 | $47,600 | $106,500 |
Source: Public Records
Map
Nearby Homes